Unitiy Dashboard Tabular & Graphical Help Guide
Table of contents
- About Unity Dashboard
- Key Features
- System Requirements
- Internet & Firewall
- Initial Setup
- Introduction
- Installation Folder
- Confirm Installation
- Installation Progress
- Installation Complete
- Launch Unity
- Getting Started
- Entering Login Details
- Entering Connection Details
- About
- Settings
- Authentication
- Network
- Display and Statistic Settings
- Configuring Service Levels
- Home Page
- User Groups
- Add/Edit User Group
- User Groups [for non-acd environments]
- Selecting Statistics in Display Template
- Tabular templates
- Add/Edit Display Template
- Selecting Statistics
- Configuring Thresholds
- Graphical templates
- Add/Edit Display Template
- Tiles:
- Badges:
- Half gauge:
- Full gauge:
- Charts:
- Selecting from the layout pre-sets
- Data Source
- Adding graphical elements
- Configuring the statistics
- Thresholds
- Creating Views
- Dashboard
- Call Centers only
- Agents only
- Call Center & Agents
- How to Retrieve Logs
- From running application
- Troubleshooting
About Unity Dashboard
Unity Dashboard is a Microsoft Windows application, which provides real-time inbound and outbound call statistics for Call Centers, agents and custom User Group. This application provides the ability to group users together to get call summary information outside of the Call Centers and configure their display of information along with call summary information for users already grouped to Call Centers.
Please note: that you will find all statistic explanations in a separate document.
Key Features
System Requirements
- Unity will require approximately 200MB of hard drive space on the local machine
- By default the install directory is C:\Program Files (x86)\Unity Dashboard
- Minimum computer spec: CPU: dual core 3Ghz. Ram: 8GB. Video Card: 256MB onboard RAM. As a general note, the requirements to run Unity Dashboard are considerably less than those required to run Windows
- Unity can be rolled out as an MSI file, which supports Active Directory group profiles
- Unity is only supported on Windows 7, Windows 8.1 and Windows 10
- Both 32 and 64-bit versions of Windows are supported. There are no special permissions required to install Unity
- Unity Dashboard is required to be running at all times as all statistics are pushed live. On first use, Dashboard will only start calculating statistics from the moment it connects successfully.
Internet & Firewall
Unity requires access to the below locations, which may require firewall rules to be added on the customer premises:
- TCP port 2208 to the OCI server
- TCP port 8011 to the CTI Server
- HTTP/HTTPS access to portal.unityclient.com
Initial Setup
Introduction
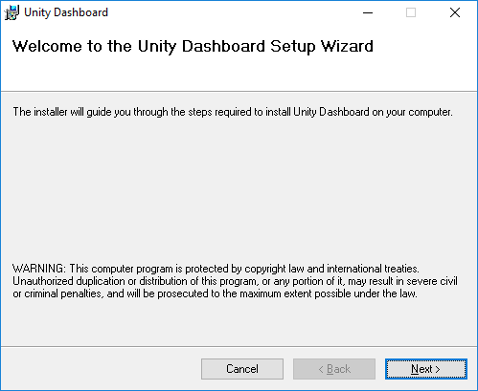
After double clicking on the installer, click the ‘Next’ button to proceed.
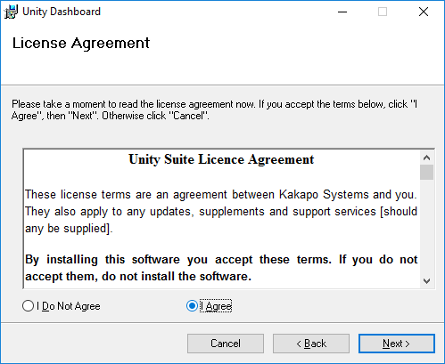
This step asks for confirmation that you understand and accept the Unity Dashboard Suite License Agreement. Select ‘I Agree’ and click ‘Next’ button.
Installation Folder
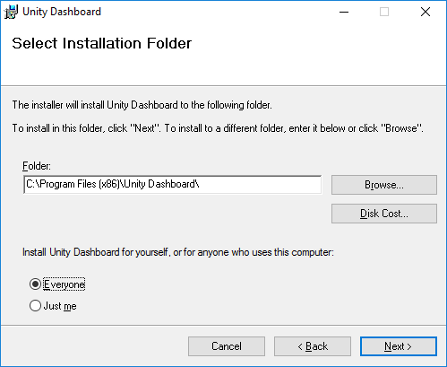
This step allows you to change the location where Unity Dashboard is installed. Click ‘Next’ button to proceed.
Confirm Installation
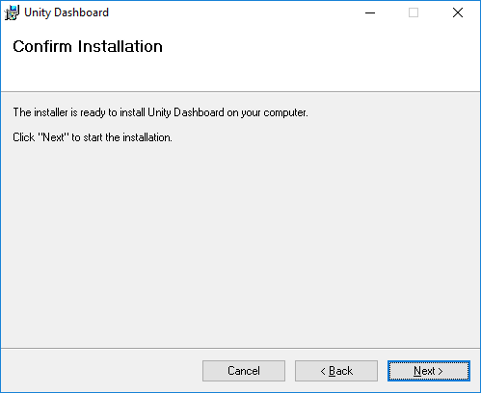
To confirm and install, click Next button.
Installation Progress
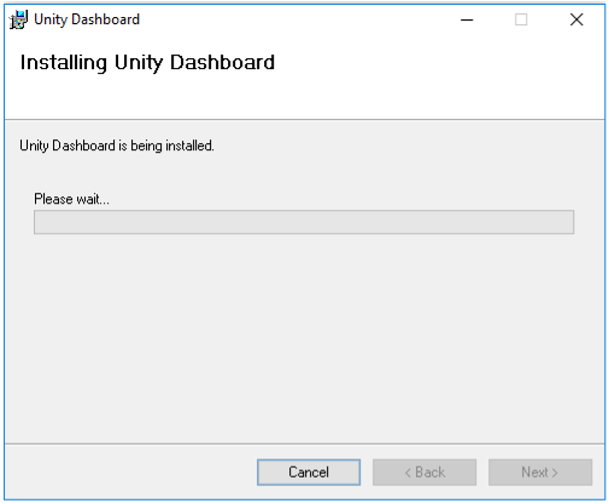
The progress during installation of Unity Dashboard application is shown here.
Installation Complete
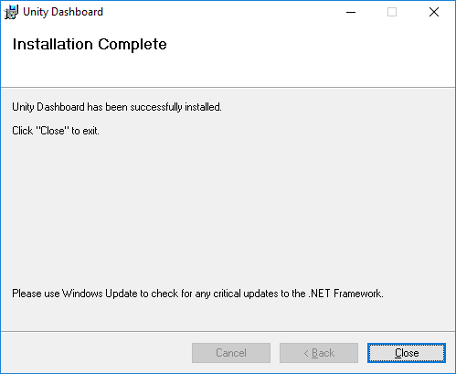
At this point Unity Dashboard is successfully installed on your system.
Launch Unity
After completing the installation, you will find the Unity Dashboard shortcut ![]() in Desktop on your system. Double click to launch Unity Dashboard.
in Desktop on your system. Double click to launch Unity Dashboard.
Getting Started
Entering Login Details
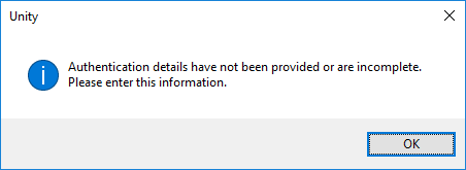
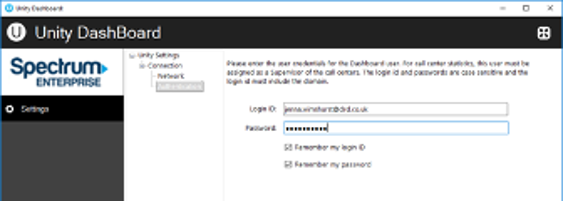
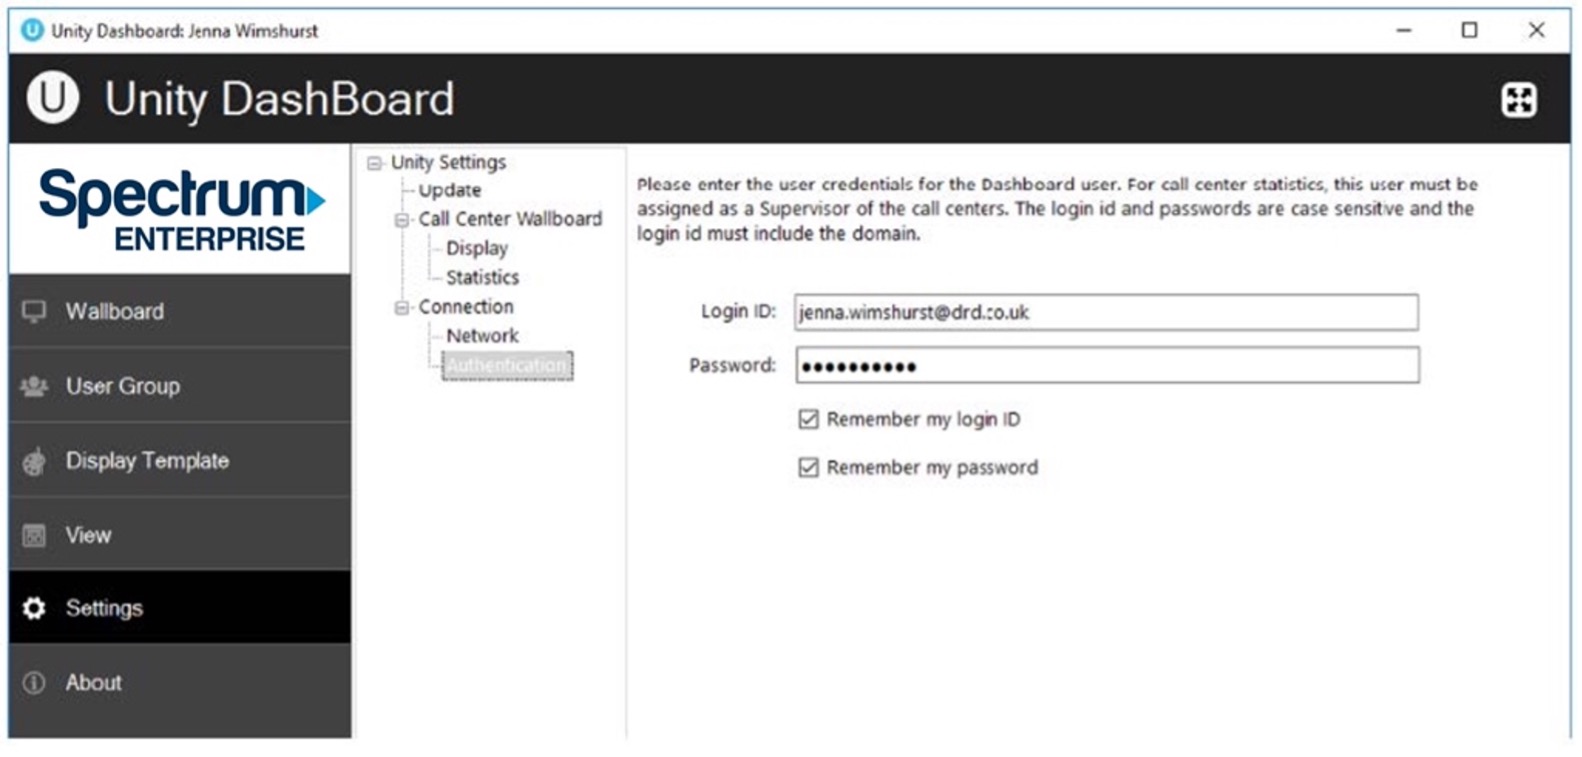
You will be prompted to enter authentication details when you first start Unity Dashboard or if the login details entered were incorrect. If Dashboard is being used to display call center statistics, the Login ID must belong to a Supervisor of the call centers. Only the call centers that the user is Supervising can be displayed and only the Agents that belong to those call centers can be displayed.
You may be required to include the domain as part of your login ID. Please contact your service provider if you are unsure what this is.
Entering Connection Details
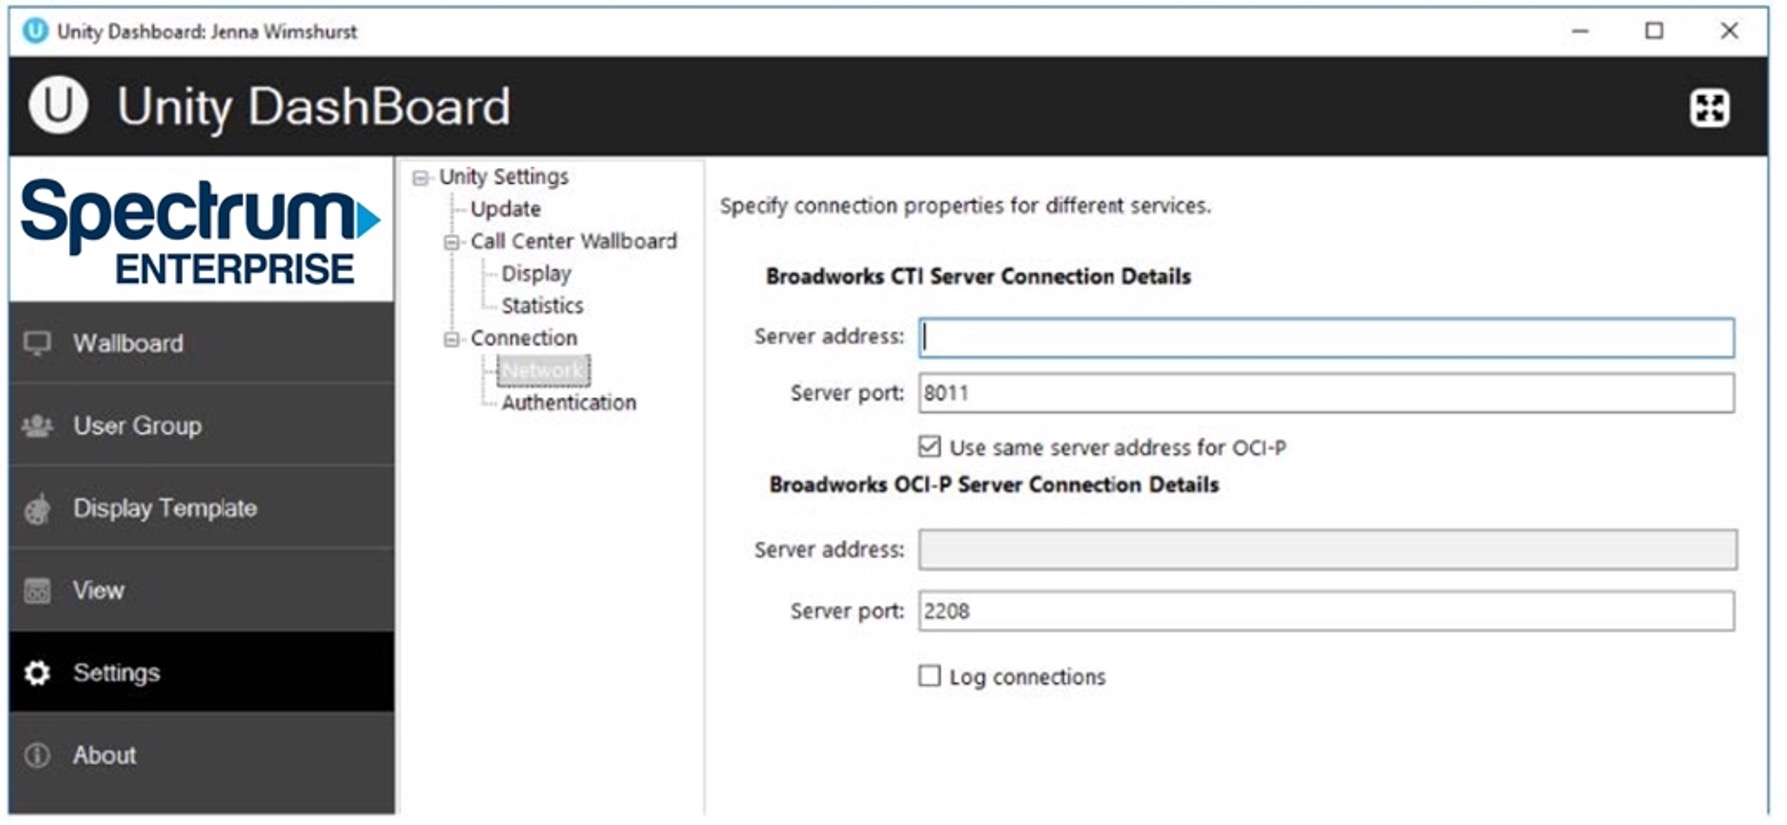
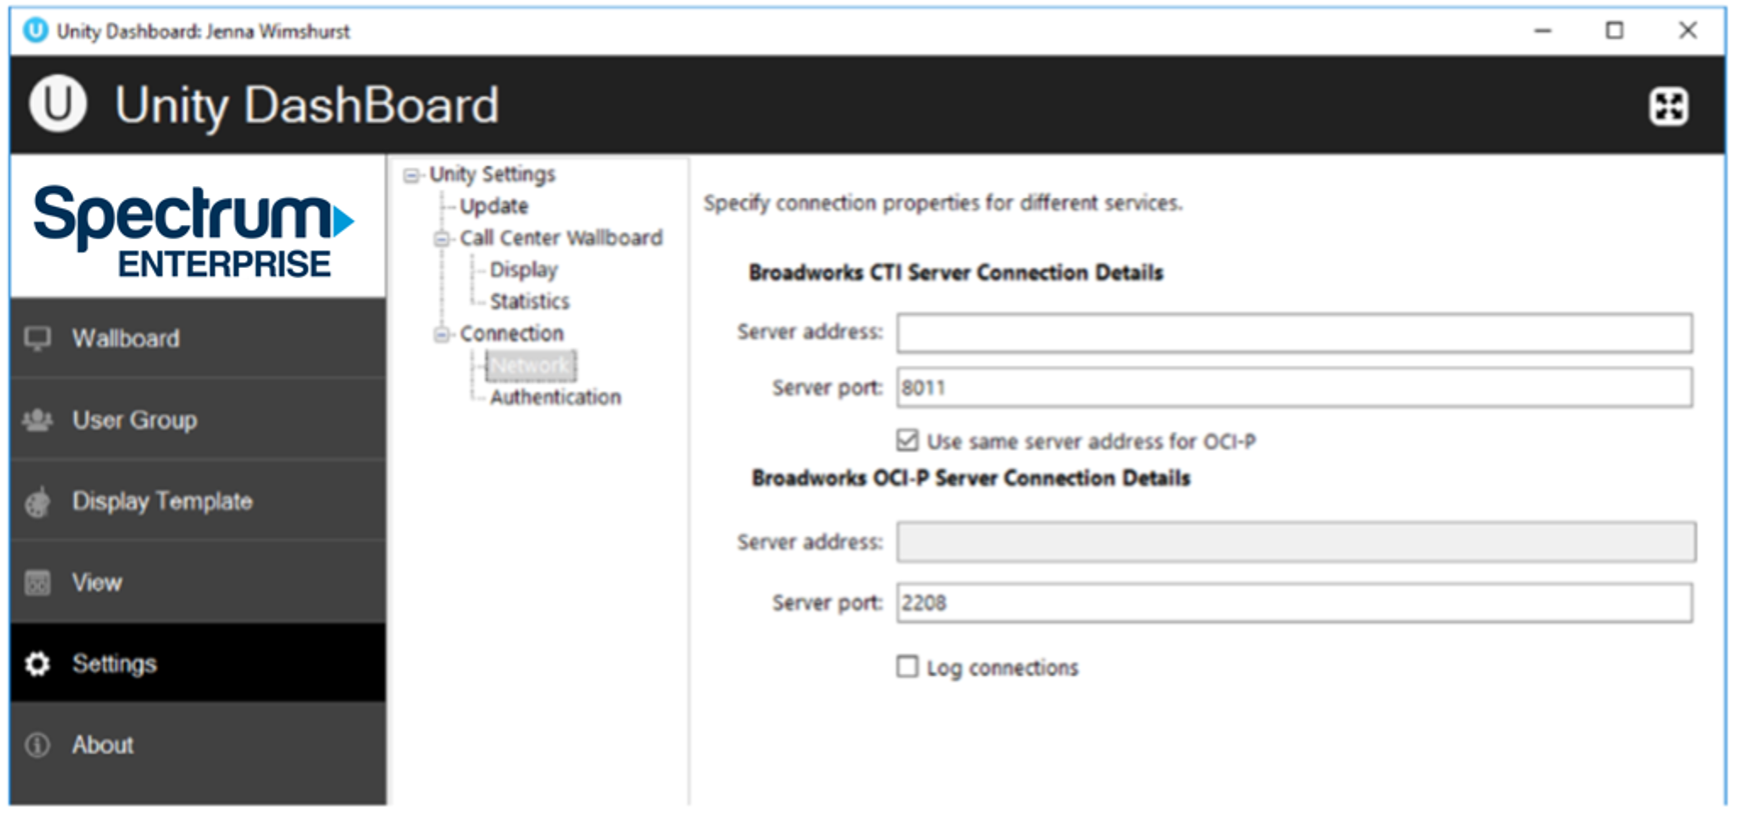
When you open Unity Dashboard for the first time, you will need to select Network from the Settings tree and provide connection details. Please contact your provider to confirm these details if unsure.
About
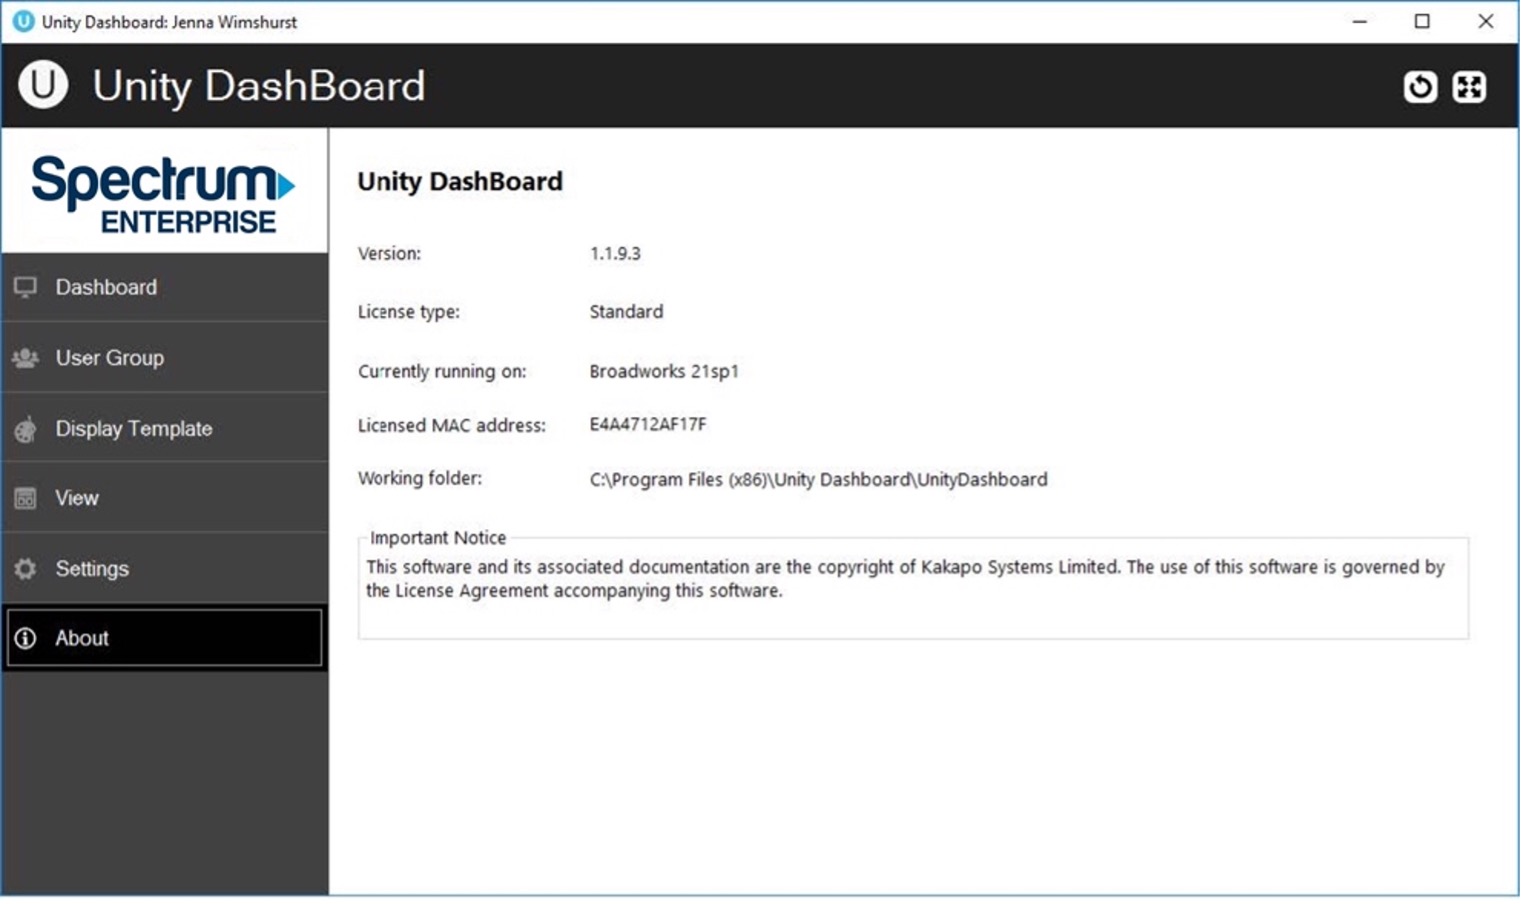
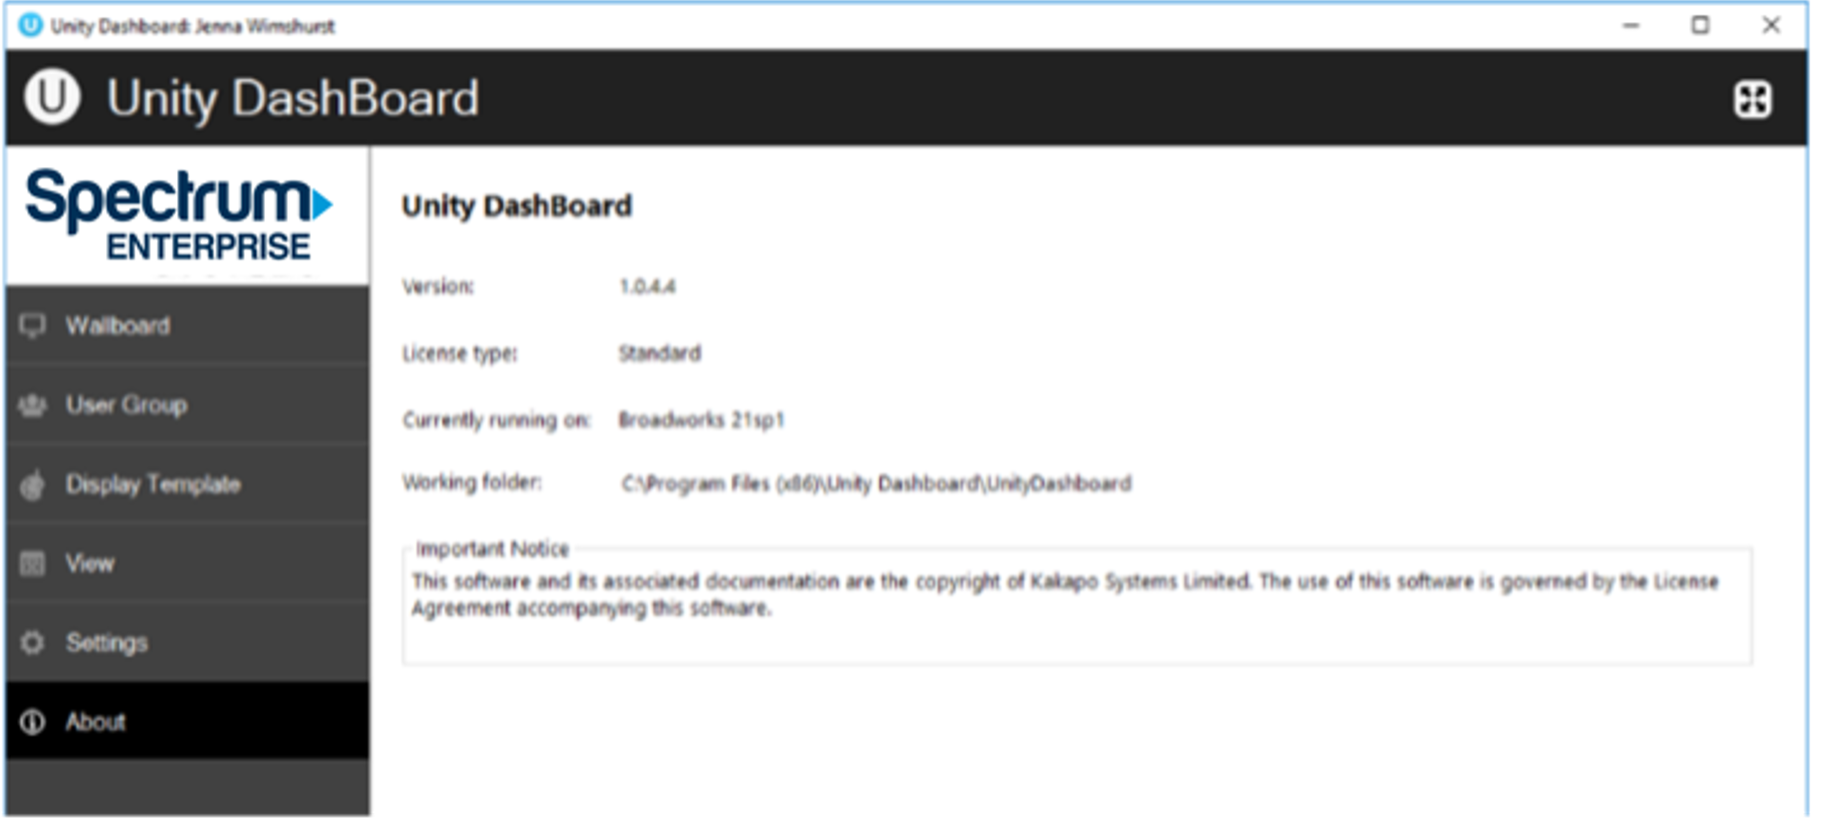
This page displays the information about the application and logged in user. The user’s license type, the host BroadSoft platform release, application version and working folder are displayed here.
Settings
Authentication
To monitor Call Center statistics, the user who logs into Unity Dashboard should be a supervisor in the Call Centers that they wish to monitor. The user can update authentication details from this page.
Network
Users can update network settings from this page. Address of CTI server and OCI-P server is required. More often than not service providers have them in the same place. In such cases “Use same server address for OCI-P” checkbox allows a user to use the same server address for OCI-P as that of CTI. Tick the “Log connections” box to allow Unity Dashboard to log connections.
Display and Statistic Settings
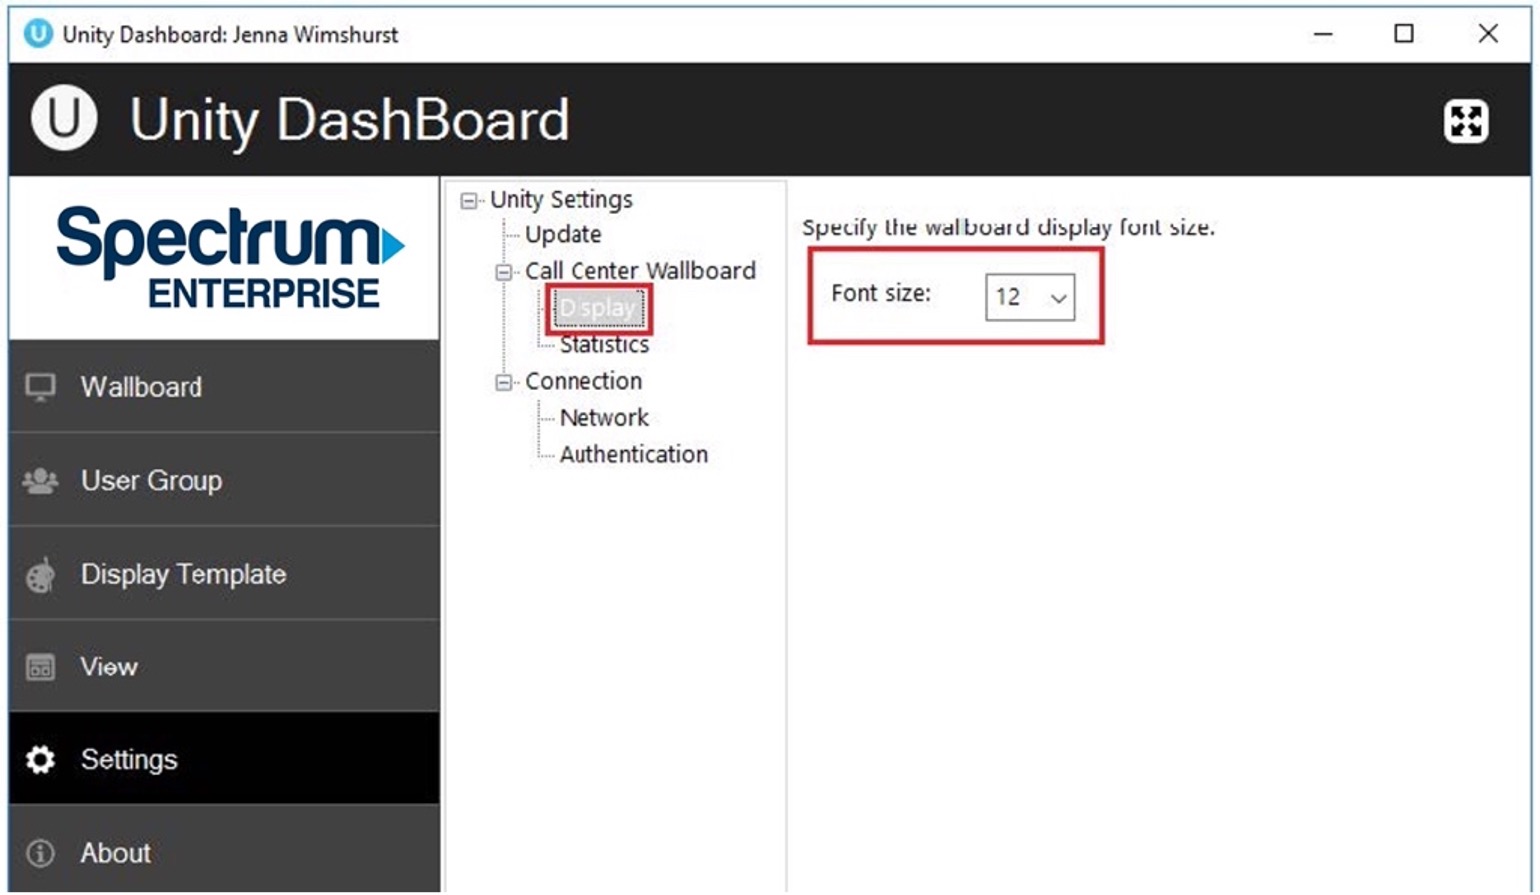
Users can change the size of the font used in the Dashboard by going to Settings>Display and changing the font size accordingly.
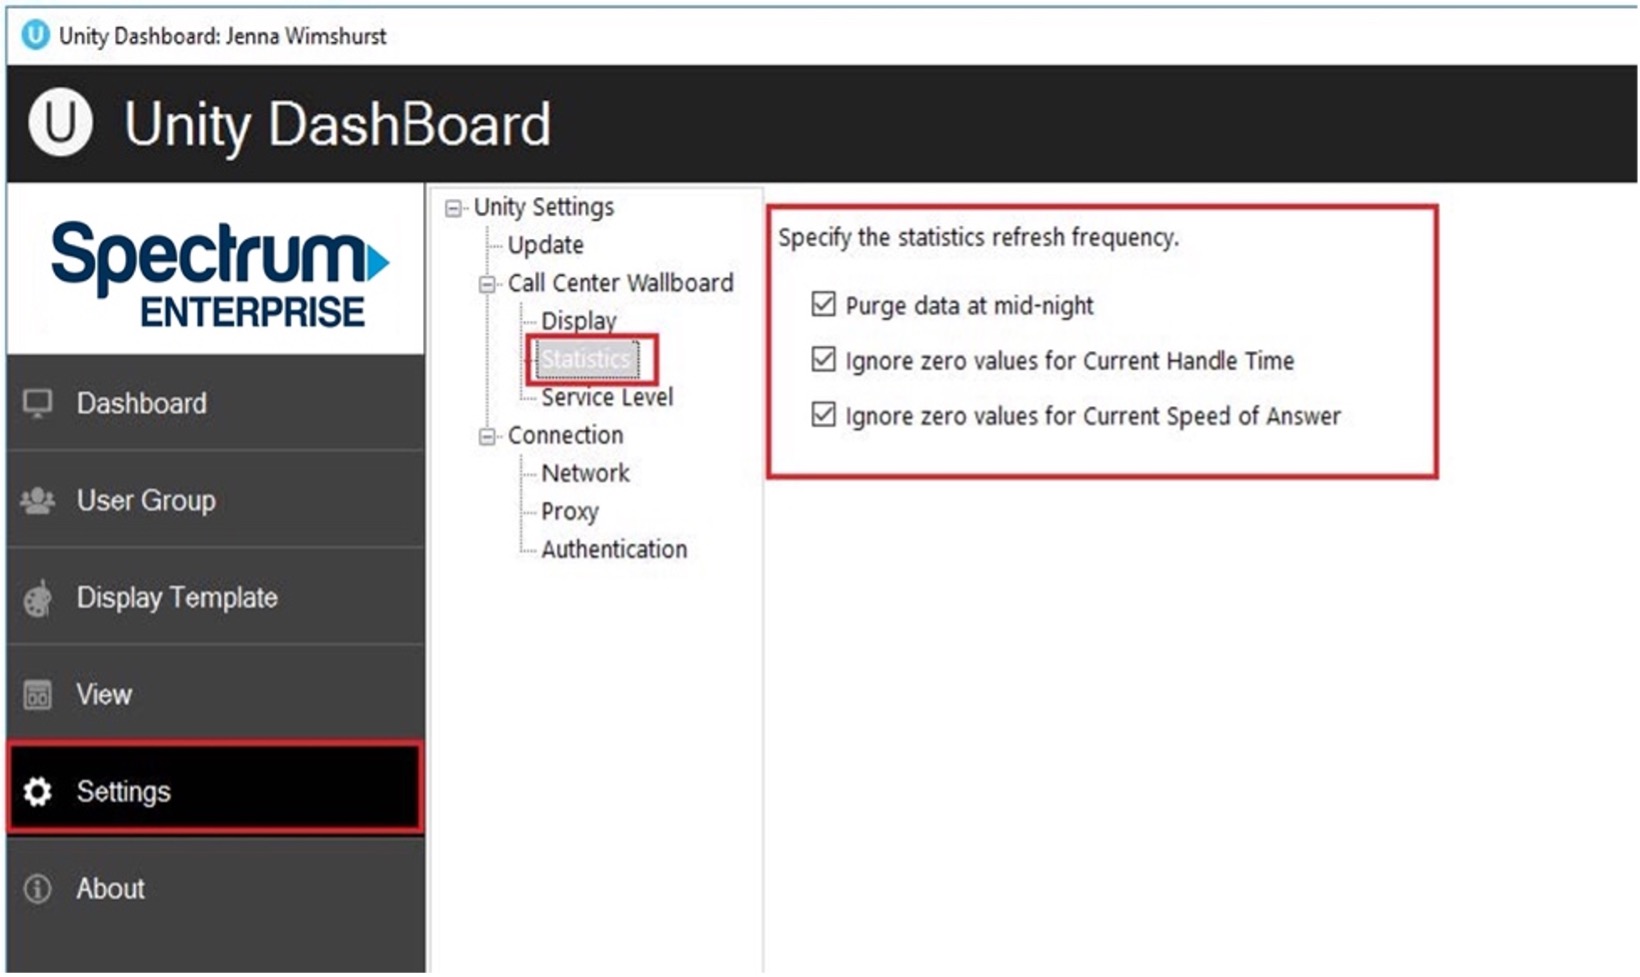
All statistics monitored in the Dashboard will start from when Unity Dashboard is opened. If configured in Settings>Statistics the data will purge at midnight, however users can disable this by unticking the box, as shown below. The zero values for “Current Handle Time” and “Current Speed of Answer” can be ignored by ticking the box, as shown below.
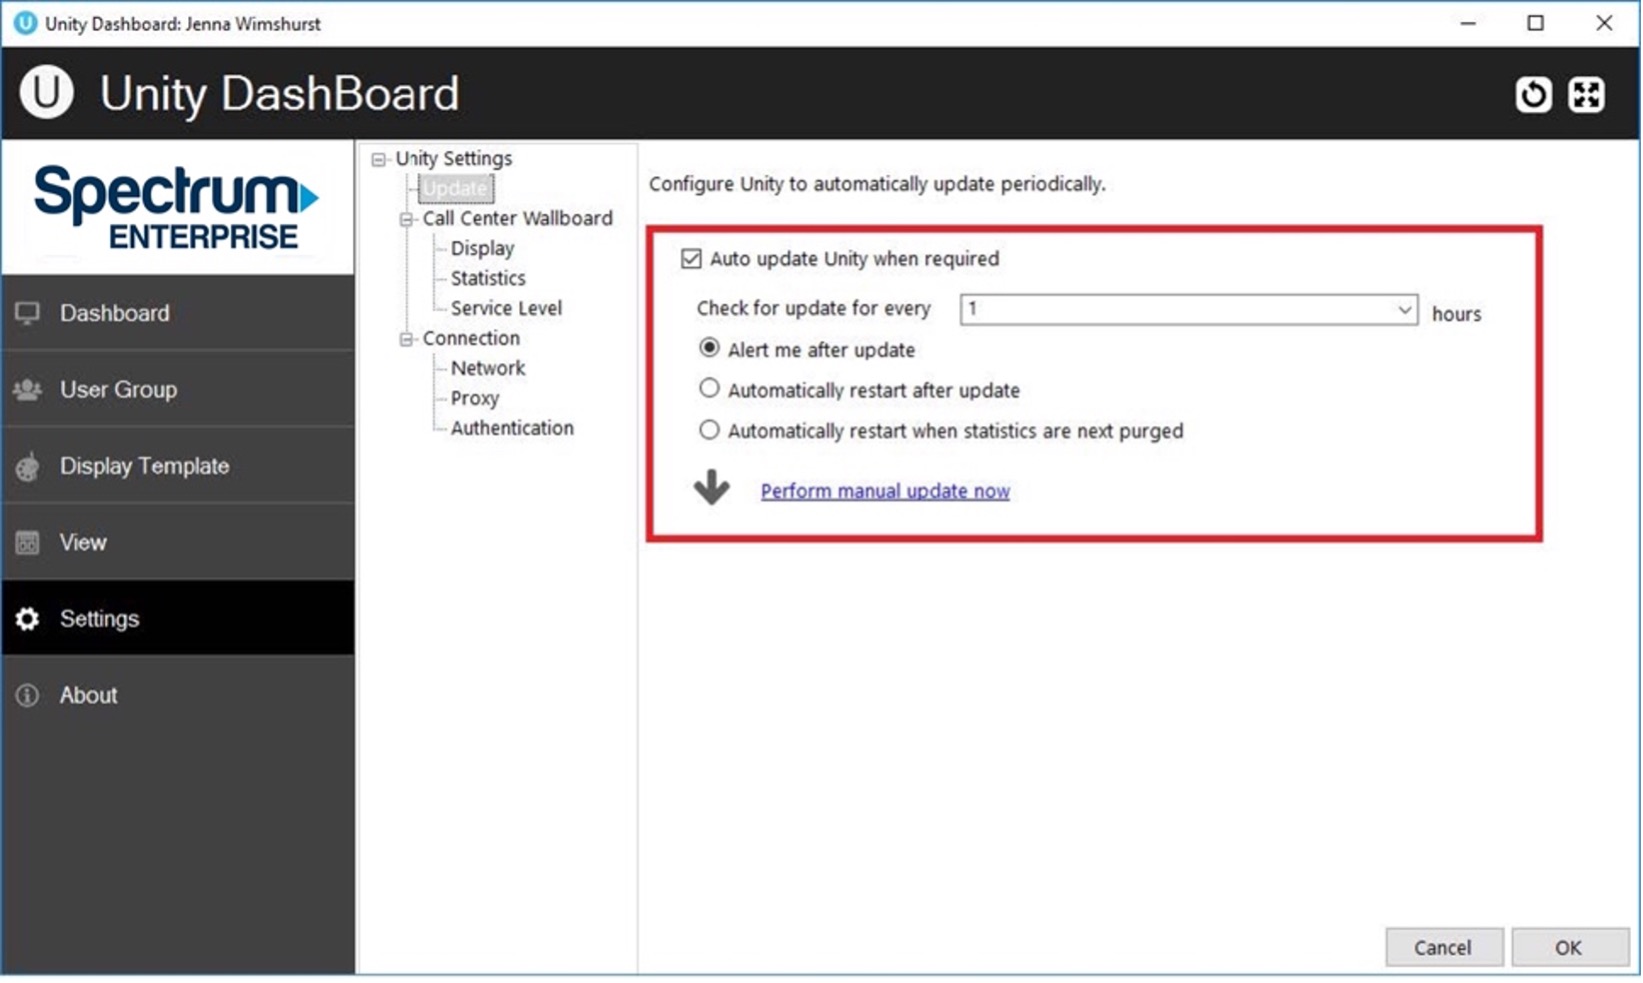
On start-up, Unity Dashboard will prompt the user if there is a new update, however, the user can also configure Unity to check for an update every 1, 3, 6, 12 and 24 hours, as shown below.
Configuring Service Levels
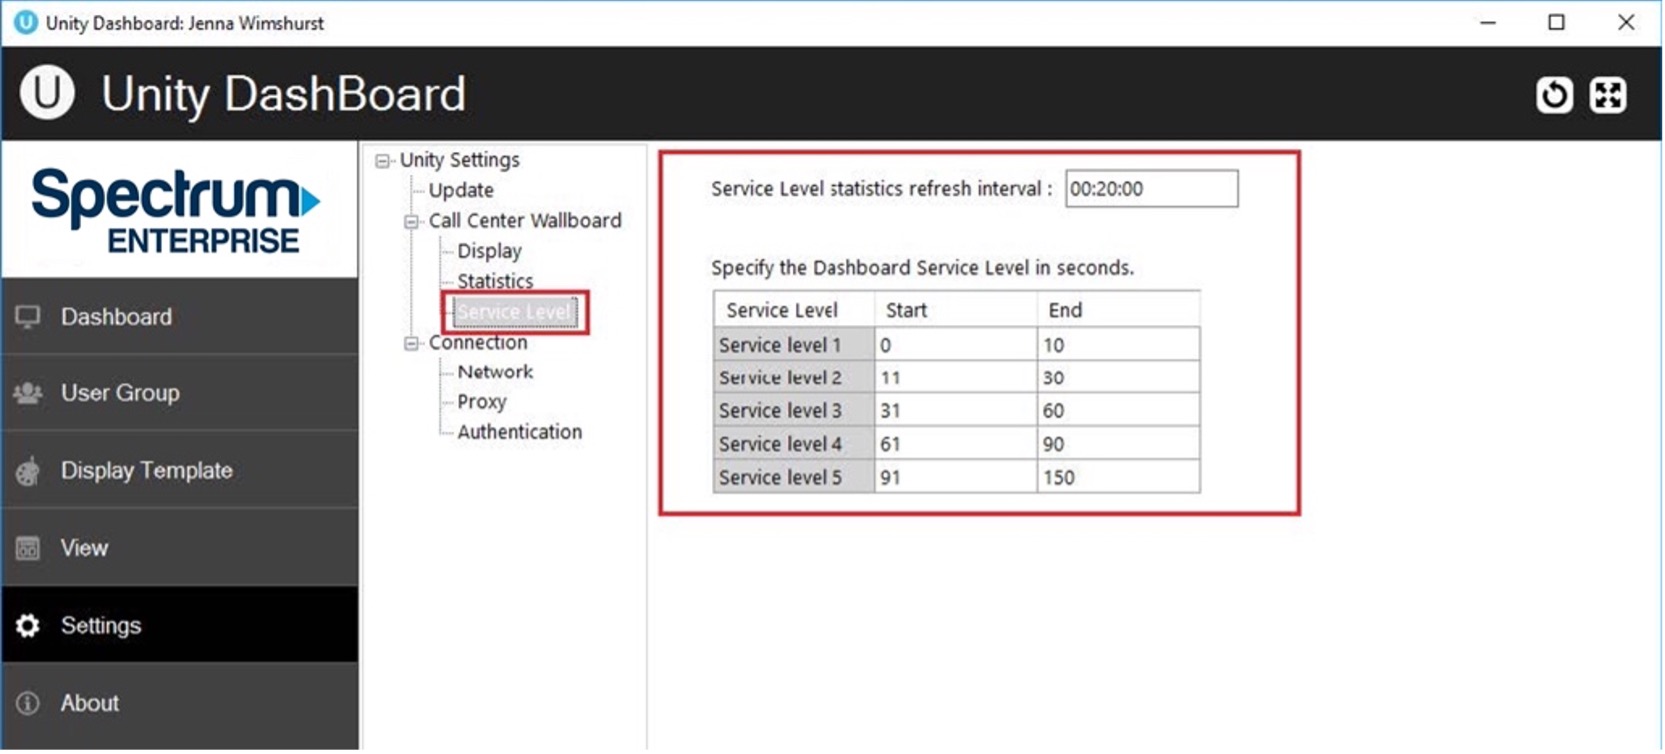
Unity Dashboard allows Users to see the average speed of answer using Service Levels. E.g. Service level 1 is calls answered within 10 seconds and Service level 2 is calls answered between 11 and 30 seconds.
To configure the Service Level statistics the User needs go to Settings> Service Level and specify the Service Level in seconds, along with a refresh interval in the HH:MM:SS format, as shown below. The refresh interval needs to be between 10 minutes and 5 hours.
Home Page
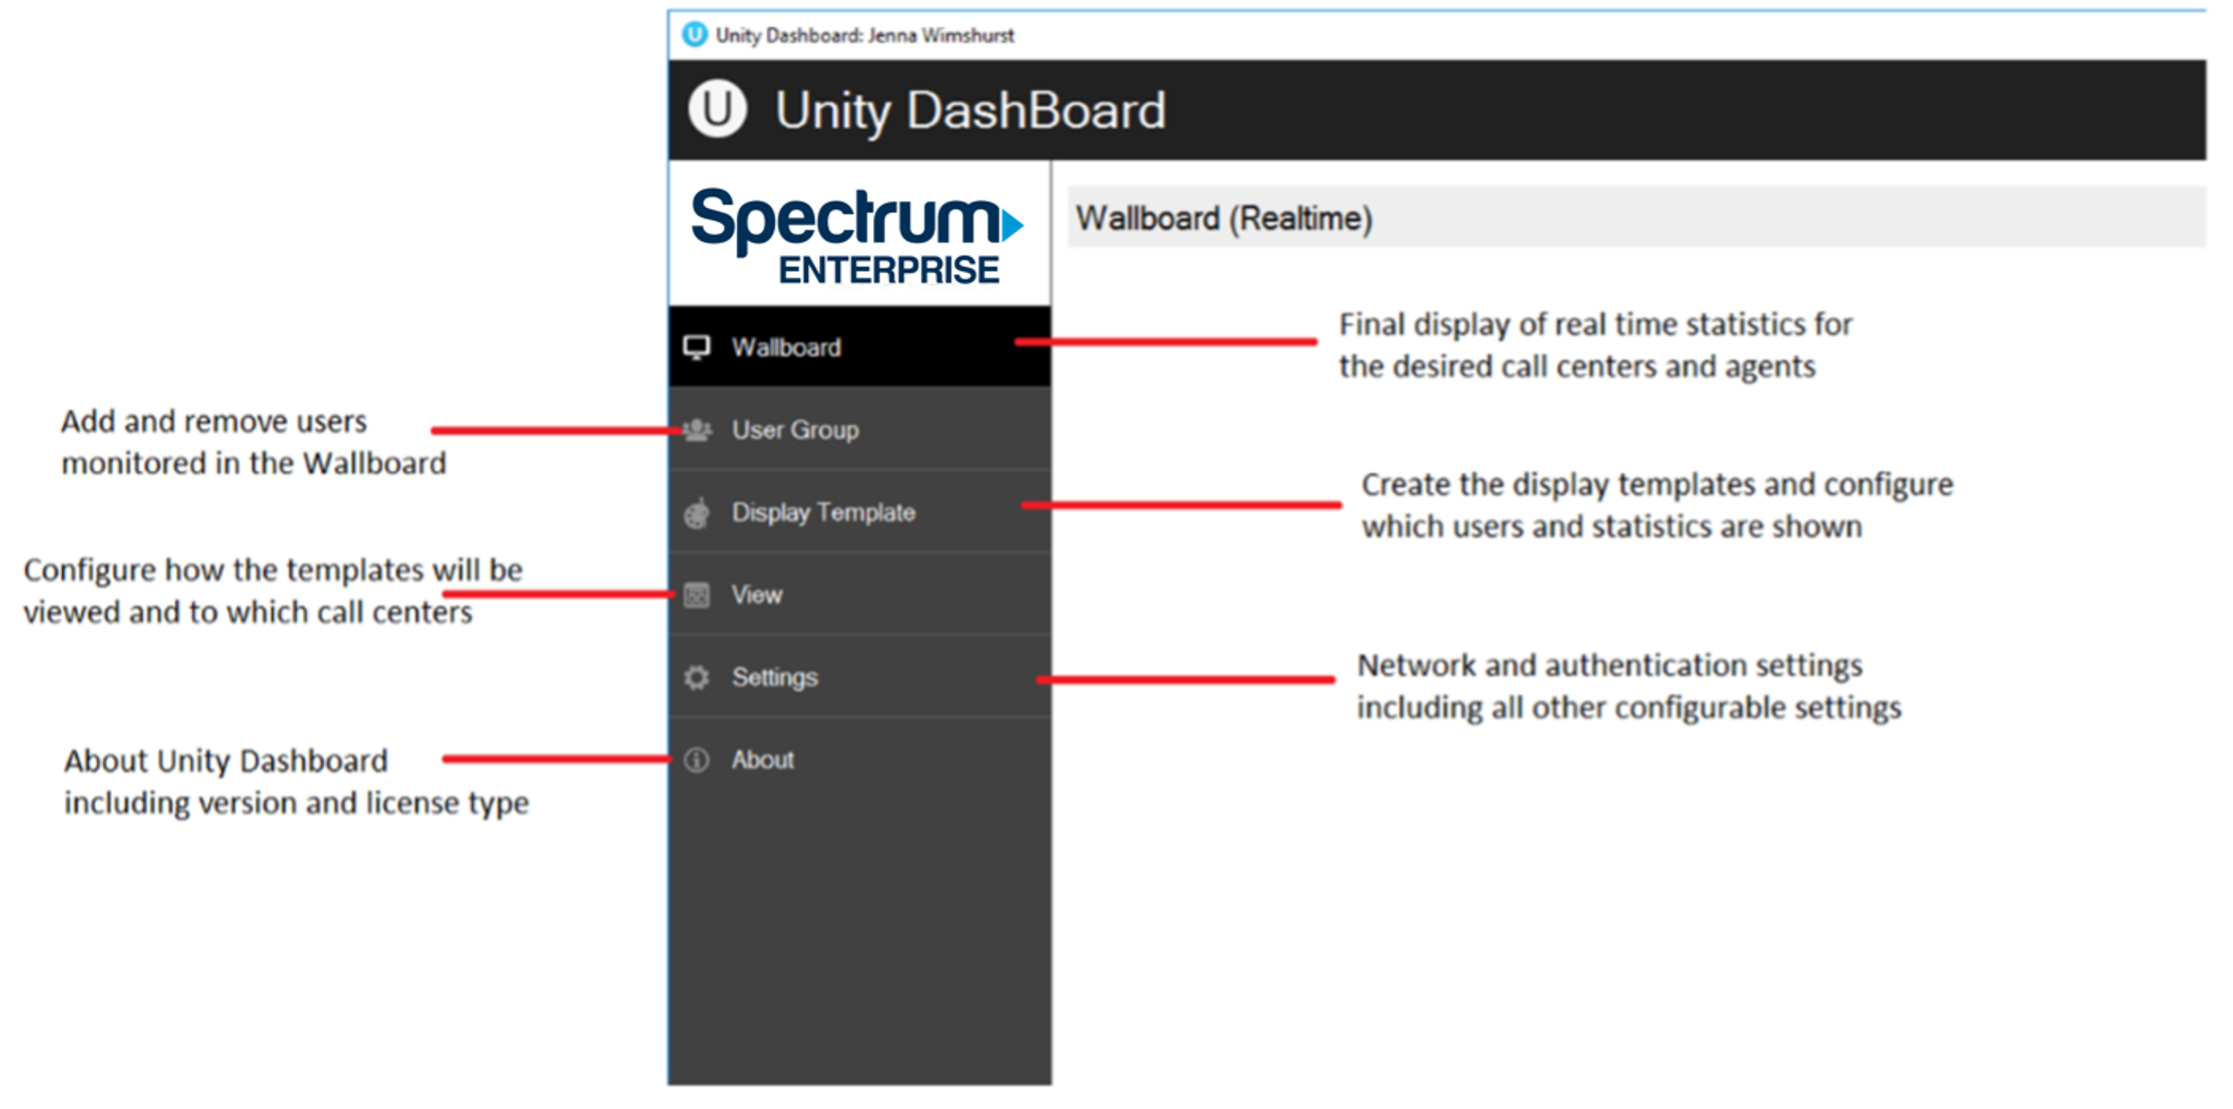
User can quickly access Dashboard, User Group, Display Template, View, Settings and About sections from the Home page. A full screen button is kept on the top right corner so that user can change to full screen and back by clicking anywhere in the top bar.
The design logic for Dashboard is that the required statistics are configured in the Display Template. These are then married to a resource, such as a User Group or a Call Center in the View window.
If non-call center statistics are being measured, a group of users is specified in the User Group panel and this becomes a listed resource in the View window.
To summarize;
Customer Use Case |
How To Configure |
Non-Call Center Statistics |
Specify the users that need to be monitored and reported on in the User Group panel. Select the required statistics in Display Template. In View, assign the Display Template against the named User Group. Several different User Groups and Display Templates can be used. |
Call Center Statistics |
Dashboard knows which Agents to report on because these are assigned to the call center.Therefore, User Group is not required. Select the statistics required in the Display Template and marry these to one or more call centers that are listed in the View panel. All call centers that the logged in user is a Supervisor for will automatically populate in the View window. |
User Groups
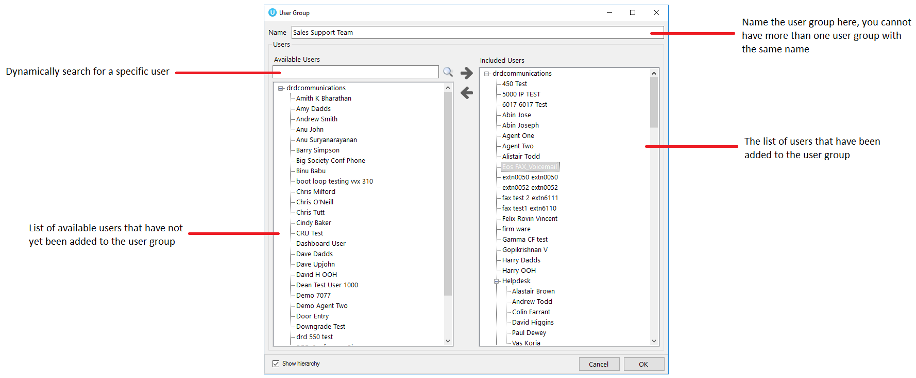
All the User Groups will be displayed here. Users can add, edit and delete User Groups using the buttons in the page shown below.
Add/Edit User Group
A User Group represents a logical grouping of users outside of a Call Center. This grouping is internal to Unity Dashboard, it is not stored or used elsewhere.
Once you click + to add a new User Group the left panel will display all the users in the Group Directory. Here you can add users into the included users list from the available users list by selecting the user and clicking the right arrow button or by double clicking the user.
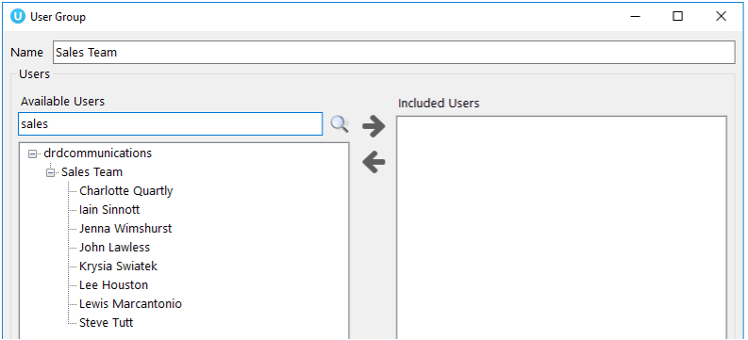
The user must enter a valid name for the user group and add one or more users in order to save it. Users can perform a search to find a user or a department from the available user list.
The “Show hierarchy” tick box toggles the Department view on and off in the left panel.
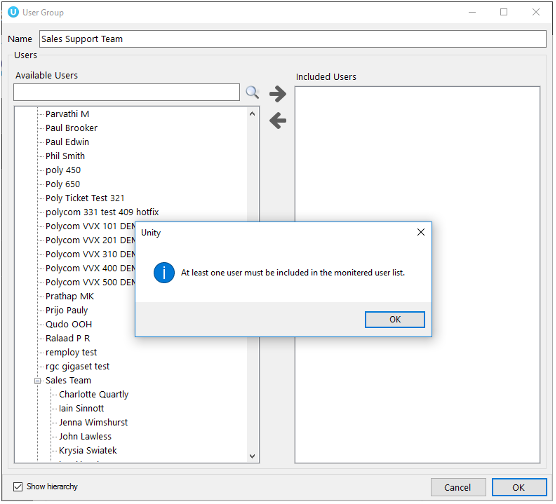
It is not possible to save a User Group where no users have been added.
User Groups [for non-acd environments]
Log into Unity Dashboard as the non-supervisor user then navigate to the User Group tab and create a new user group, as shown below.
Selecting Statistics in Display Template
The display template section allows users to create and configure both tabular and graphical templates that define grouping of statistics. Multiple display templates can be used and they are all listed underneath their section.
The user has the provision to add, edit and delete display templates using the buttons to the right of the box, the user can also edit a display template by double clicking the display template.
Tabular templates
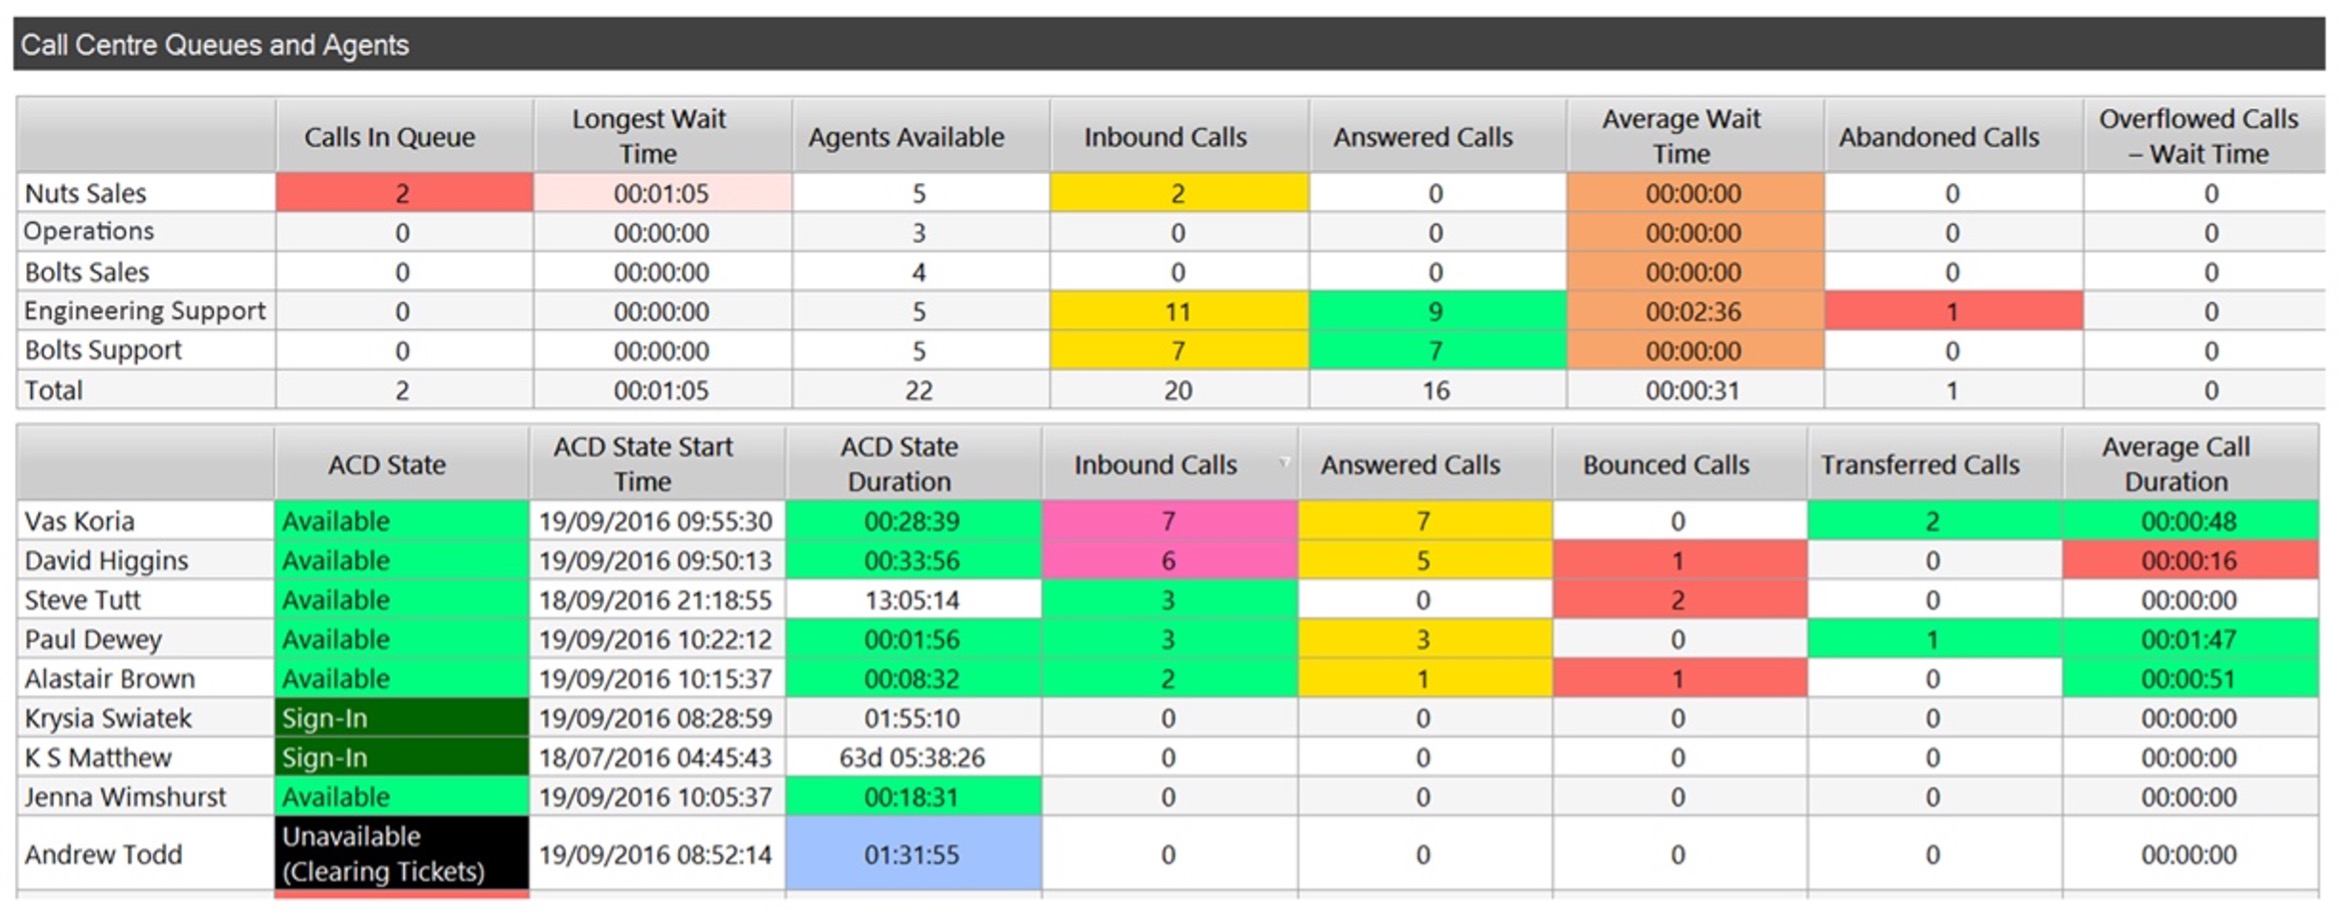
Dashboard’s tabular templates show the information in a table/grid layout with headers, rows and columns which can be presented for both call center queues and individual agents, as shown below.
Add/Edit Display Template
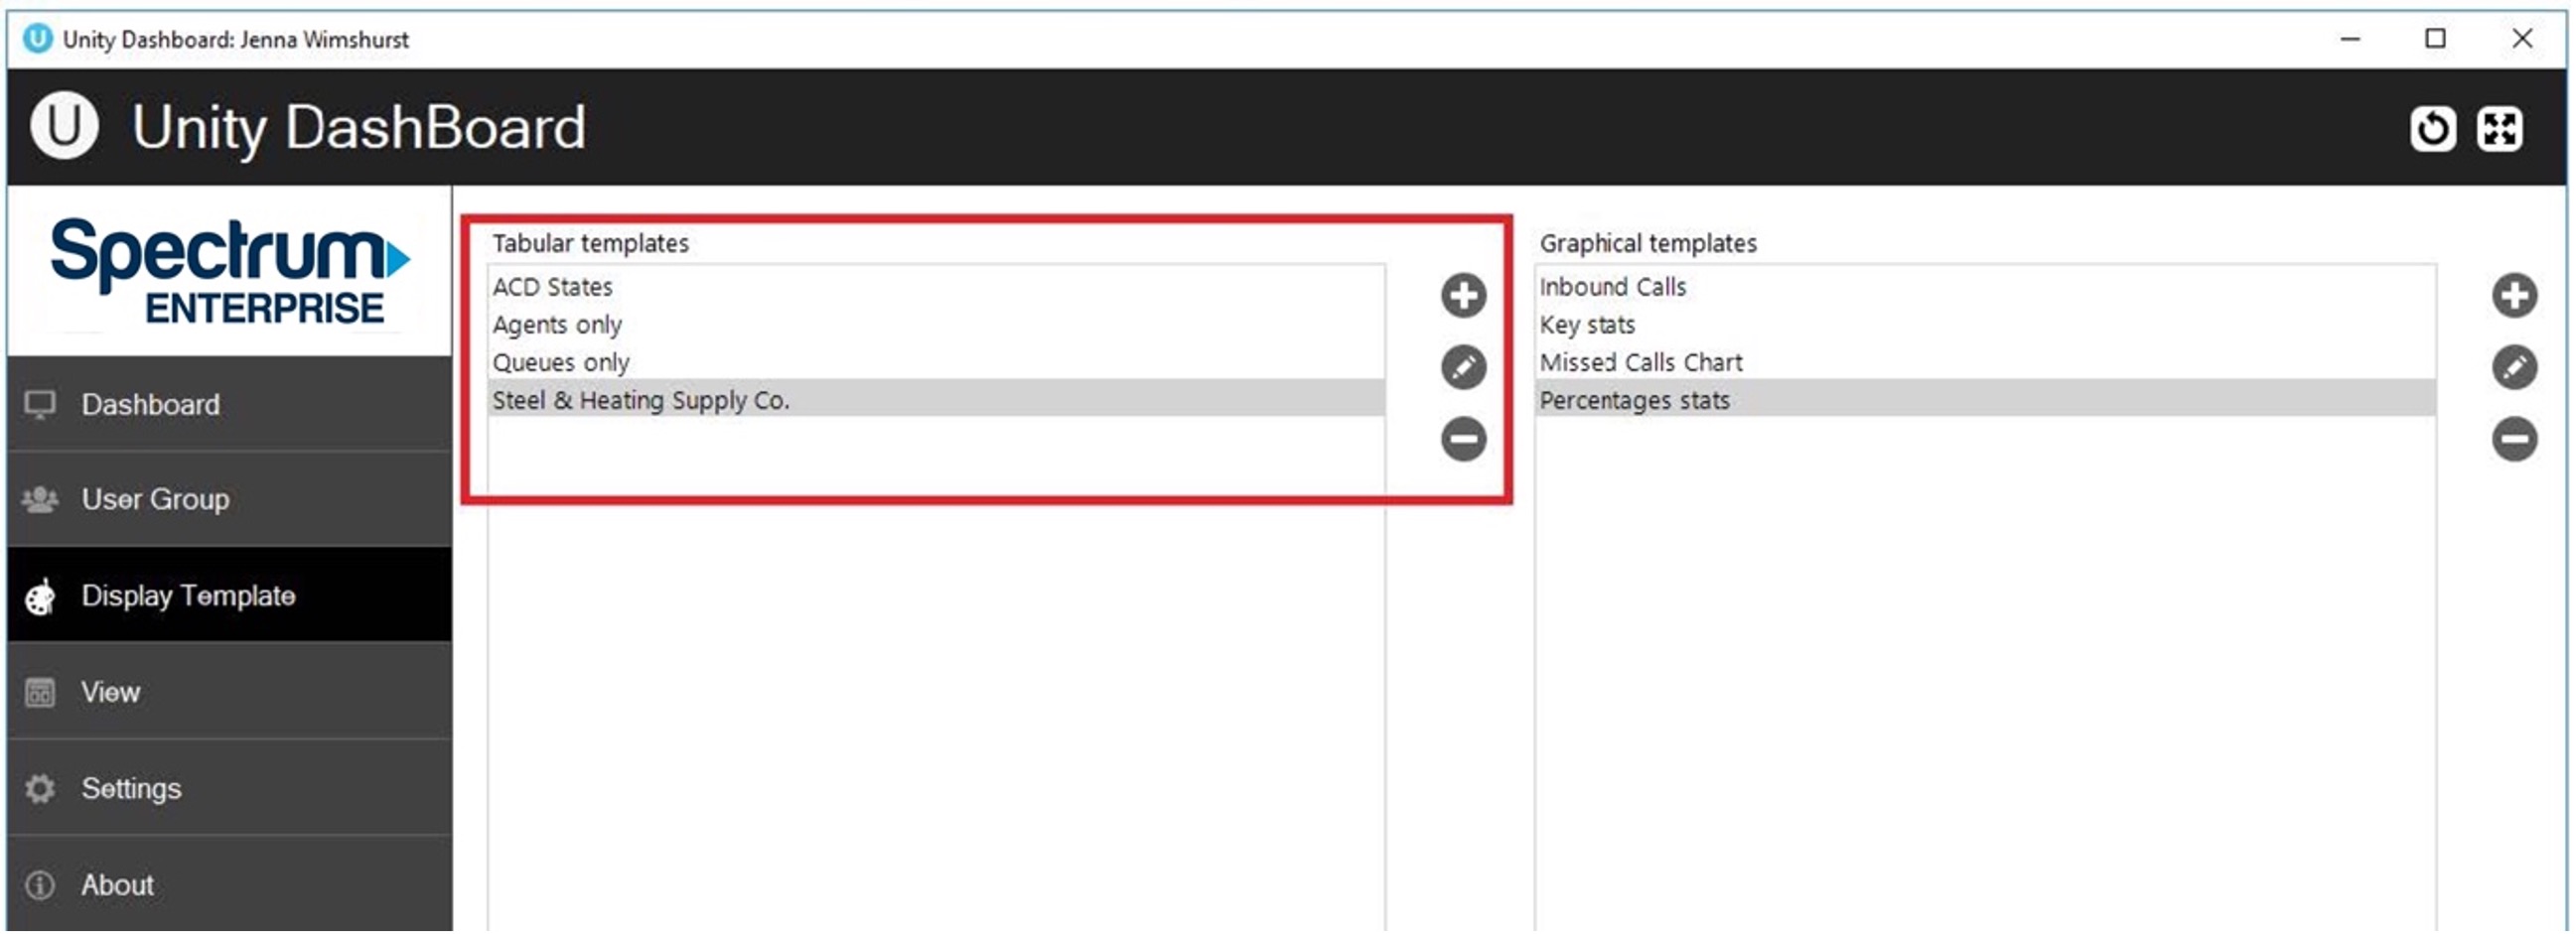
Users can add a new tabular Display Template and change any existing tabular Display Templates by using the left-hand column.
Click on the add icon to the right to create a new tabular template.
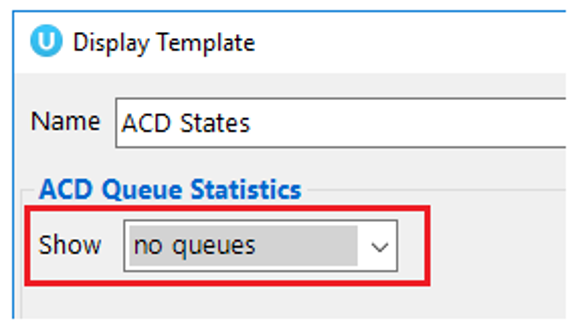
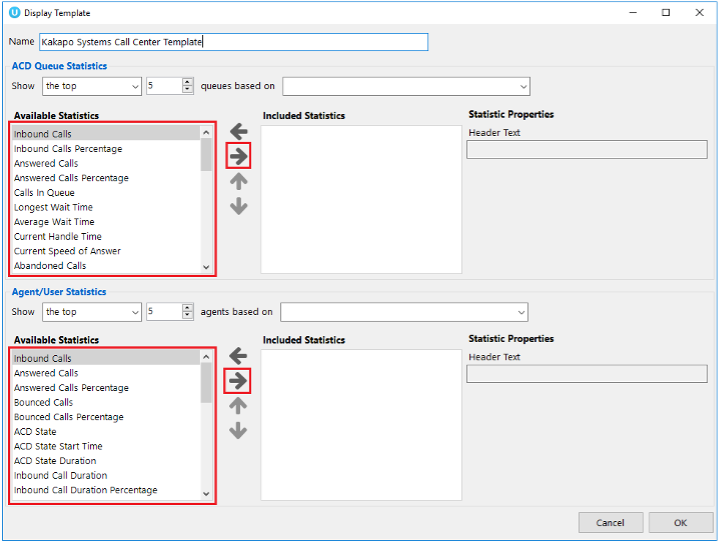
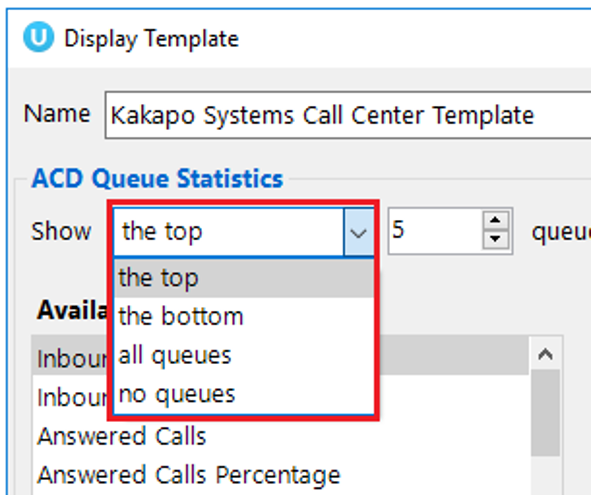
The Display Template is divided into ACD Queue Statistics at the top and Agent/User Statistics below. These are mix and match, to make a Display Template with only Queue statistics select “no agents” in the Agent/User Statistics drop list. To display only Queue Agent statistics select “no queues” in the ACD Queue Statistics Show drop list at the top.
Selecting Statistics
To add data to the included column, the user can either double click on the statistic in the available column or select the statistic and then click on the right arrow.
The User can change the order of the items in the included column list by using the up and down arrow. Users can configure the call center and agent statistics to show the statistics in a certain order based on a given metric. The queue and agent display options would be “the top”, “the bottom” “All agents” and “No agents”. If “No agents”, is selected then you won’t be able to view or configure any agent statistics.
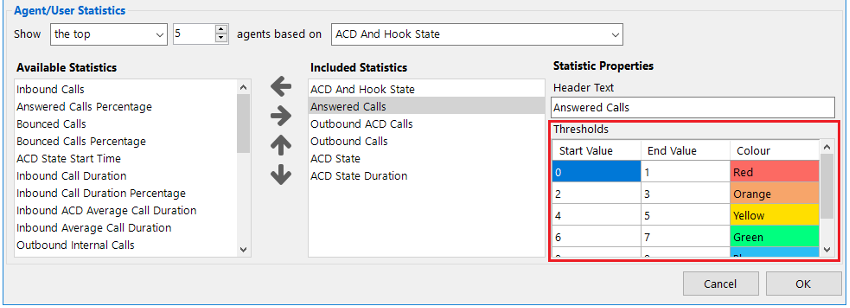
For example, in the below screenshot only the top 5 performing agents/users based on inbound answered calls will be displayed.
To rename how a statistic is displayed later in Dashboard, edit the Header Text under Column Properties on the right-hand side.
Configuring Thresholds
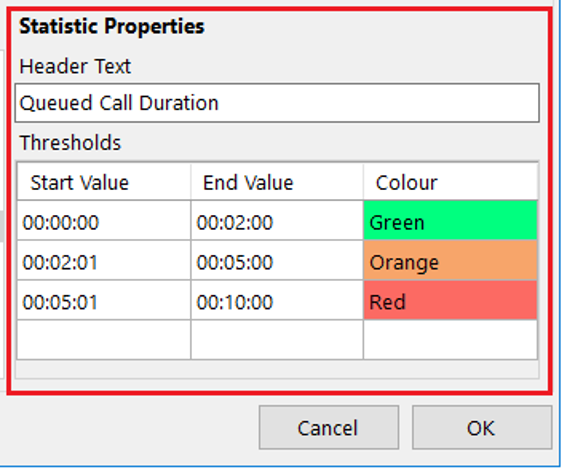
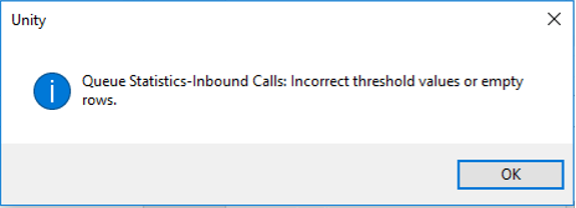
Threshold values can be set for each item in the included column list. There are two types of values which are entertained, one is a non negative integers and the other one is time span. The validation for these values are done accordingly.
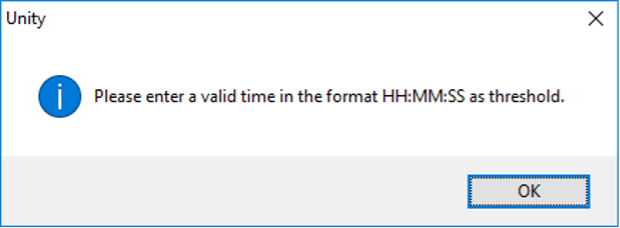
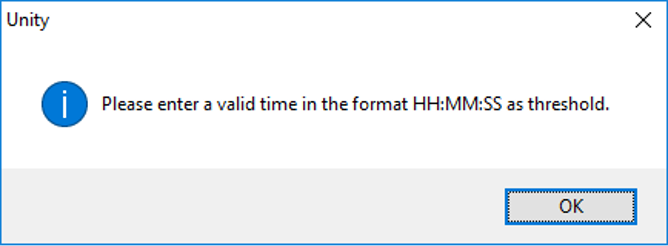
If the selected item displays time duration then the value being entered should be in time span format (HH:MM:SS). For example Average call duration, Totall call duration, Average wait time etc.
Otherwise the below shown validation message will display.
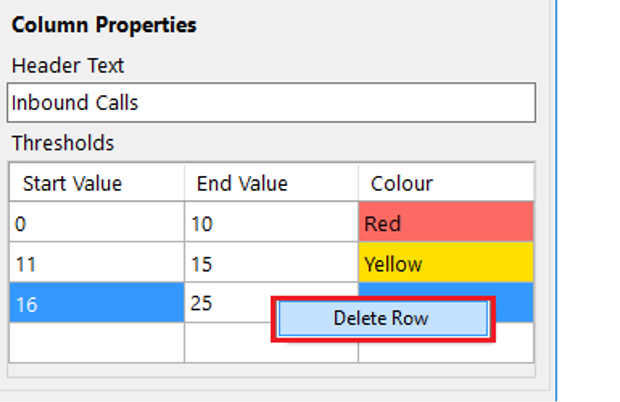
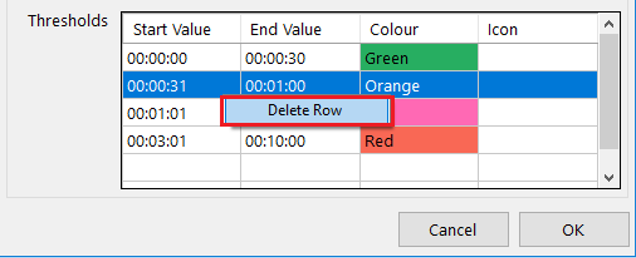
Users have the provision to delete a row in the thresholds by right clicking the desired row and clicking “Delete Row”, as shown below.
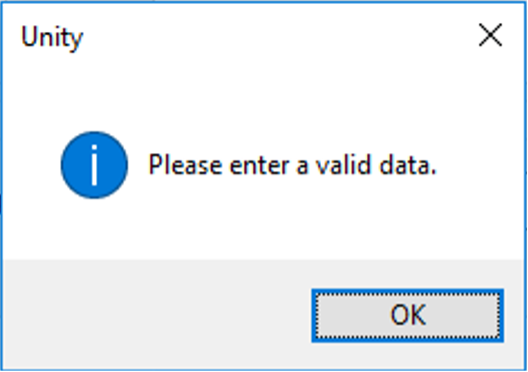
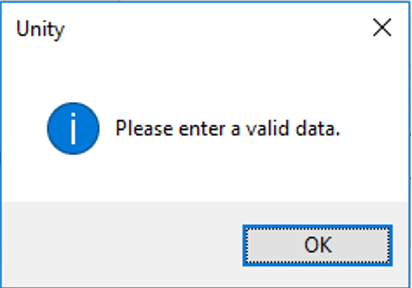
You cannot enter negative values for threshold. If you enter a negative value for a threshold, then a validation message will popup telling you to enter a valid data.
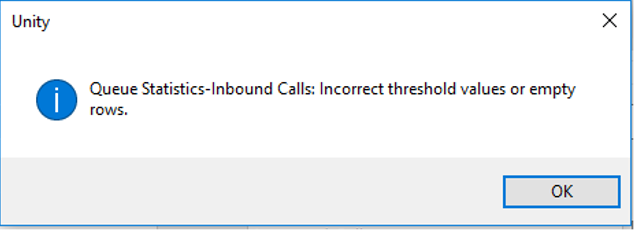
The Start value, End value, and Color should be provided otherwise the user won’t be able to save the display template; the user will be alerted with a message, as shown below.
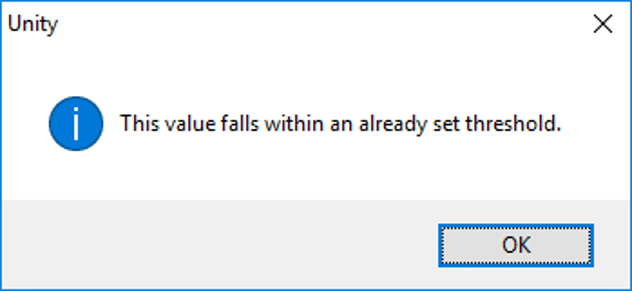
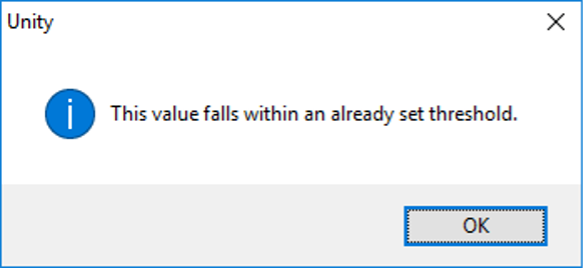
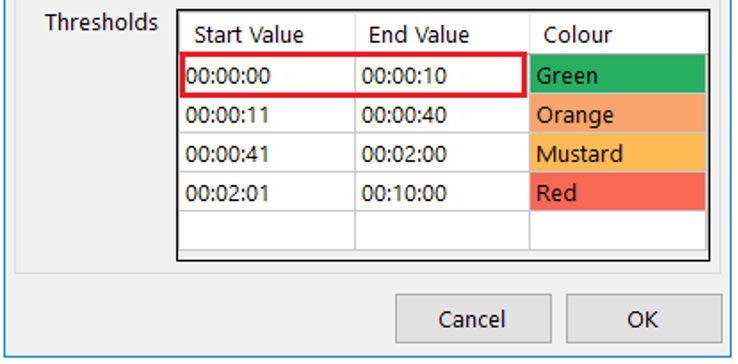
If you try to enter a value which falls within an already set threshold then the user will be alerted with a message, as shown below. For example, if the first row’s start value is 0 and end value is 10, the user is not allowed to enter 8 as the next row’s start value.
The user is not allowed to provide an end value that is lesser than the start value. In this case the below shown message will be popped up. The end value should always be greater than the start value and vice versa.
Graphical templates
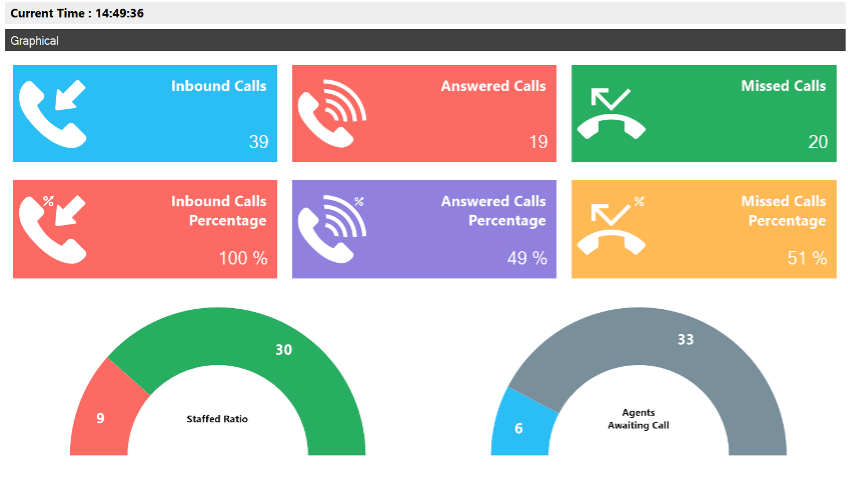
Dashboard’s graphical templates show the information in a variety of graphical elements including charts, tiles, badges and half and full gauges.
Please note: that statistics can be presented for call center queues only.
Add/Edit Display Template
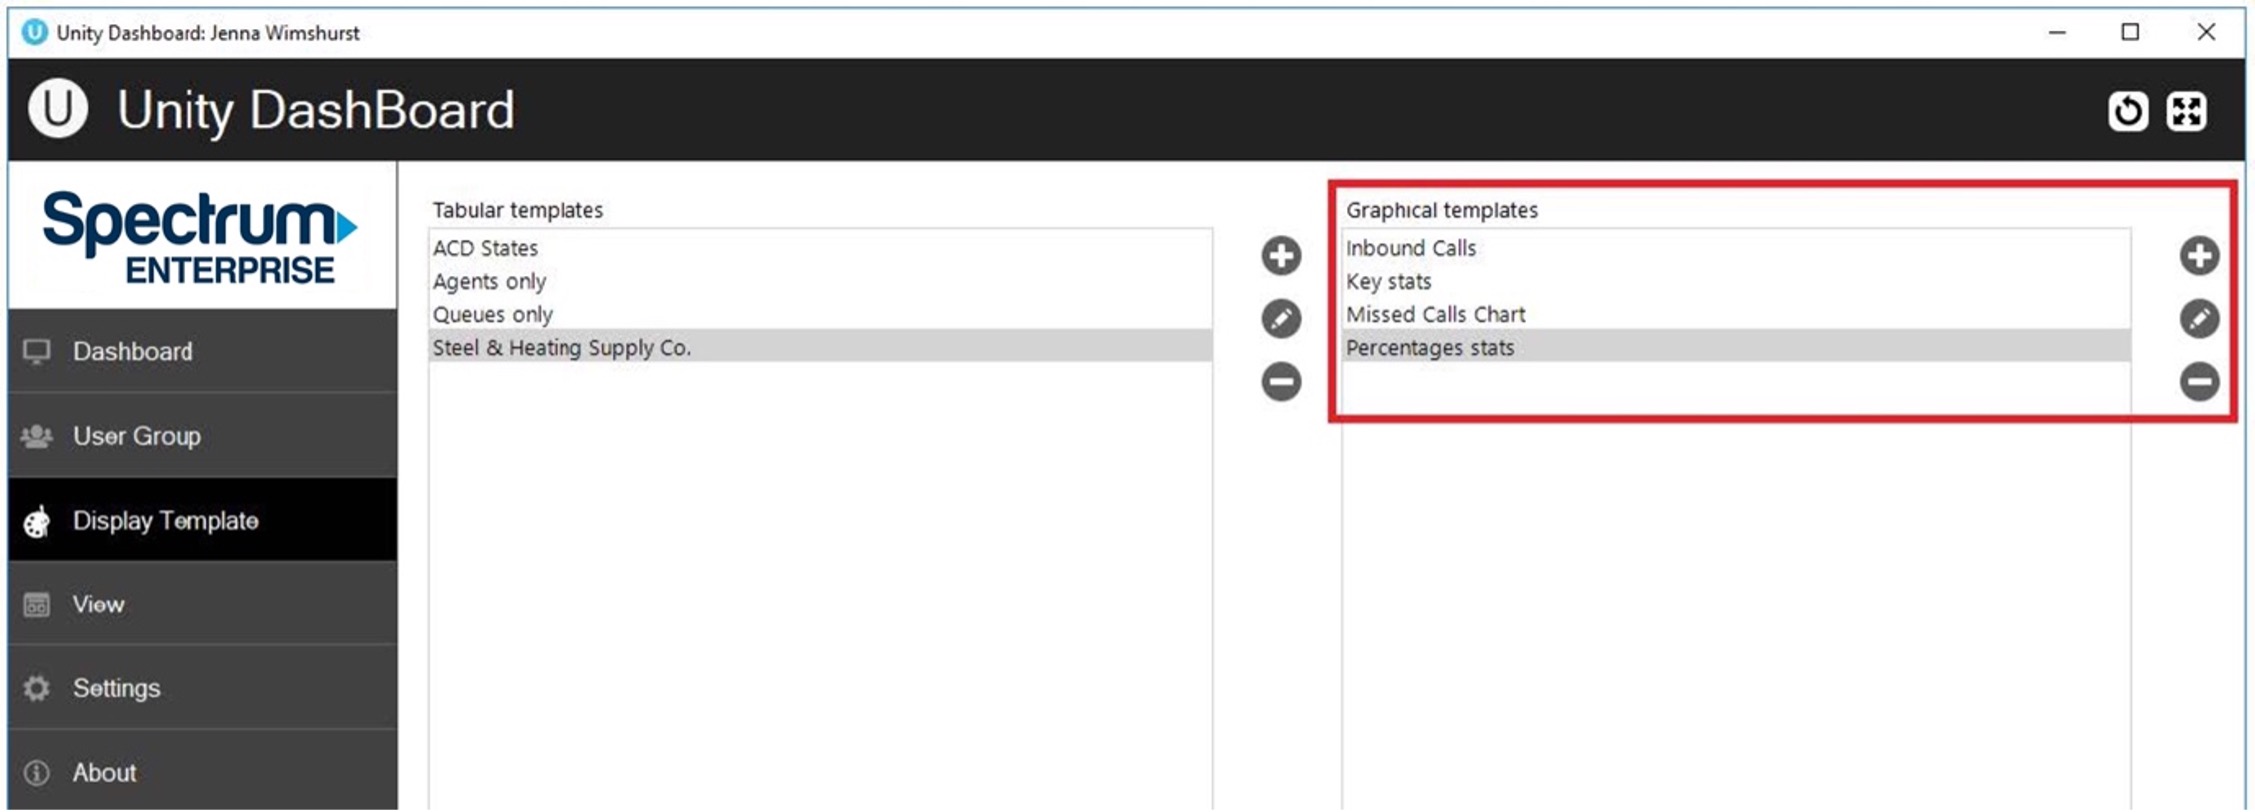
To add or edit a graphical display template go to Display Templates on the left-hand menu. The two types of templates, tabular and graphical are presented next to each other.
To add a new graphical template, click the plus icon on the far right or to edit an existing template double click the template, or select it and click the pen icon.
Tiles:
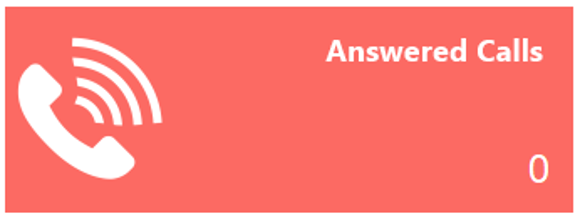
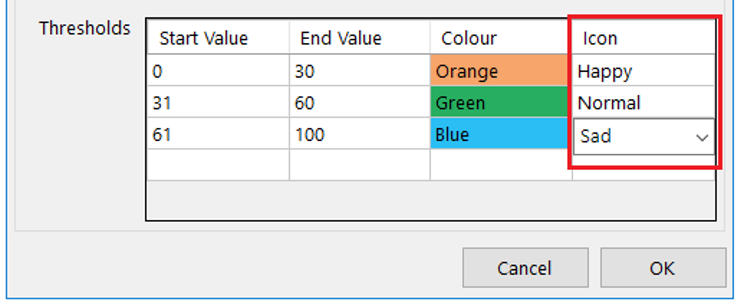
The tiles display the statistic, title, value and icon. You can add thresholds to the tiles to change color when certain values have been reached. Thresholds can also be set to change the default icon to show a smiling, normal or sad face to represent the behaviour of the configured statistic.
Badges:
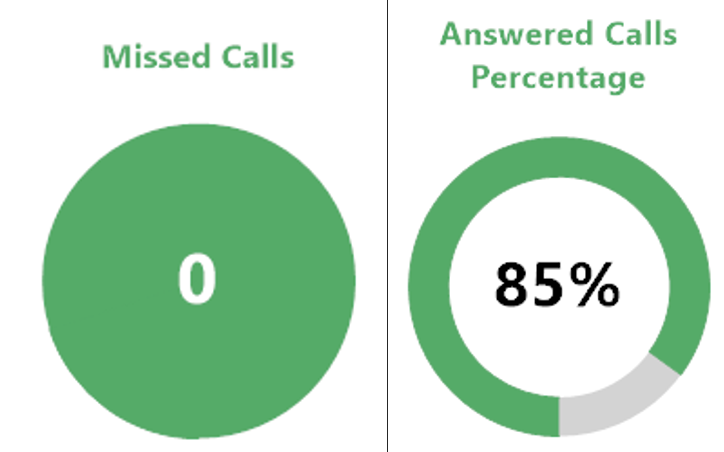
There are two types of badges; the standard filled badge and the percentage badge that features an outer ring and will only display statistics presented as a percentage. If thresholds have been set then the standard filled badge will change color completely whereas the percentage badge will just change the color of the incrementing outer circle.
If no threshold is set for the current value then the badge will be grey.
Half gauge:
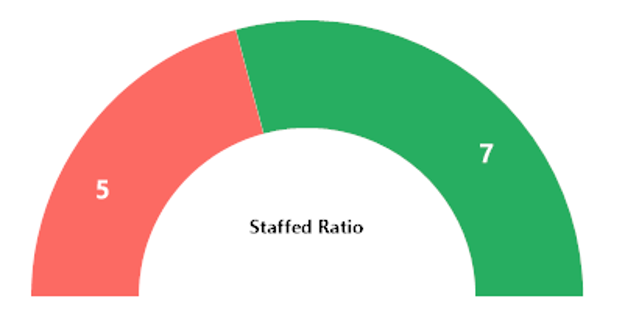
Only statistics that are presented as fractions can be displayed on a half gauge e.g. staffed ratio, 7 out of 12 agents are joined to the call center queue.
Full gauge:
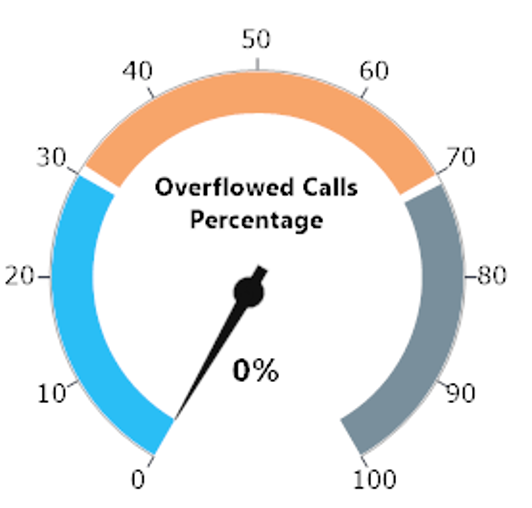
The full gauge works like a speedometer and allows users to quickly understand how the call center is behaving. In the full gauge component only statistics that are represented as percentages can be shown and the numbers on the outside can only display 0 – 100.
Charts:
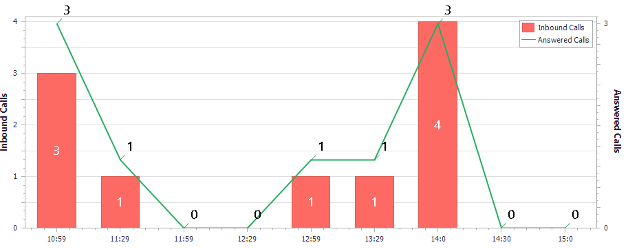
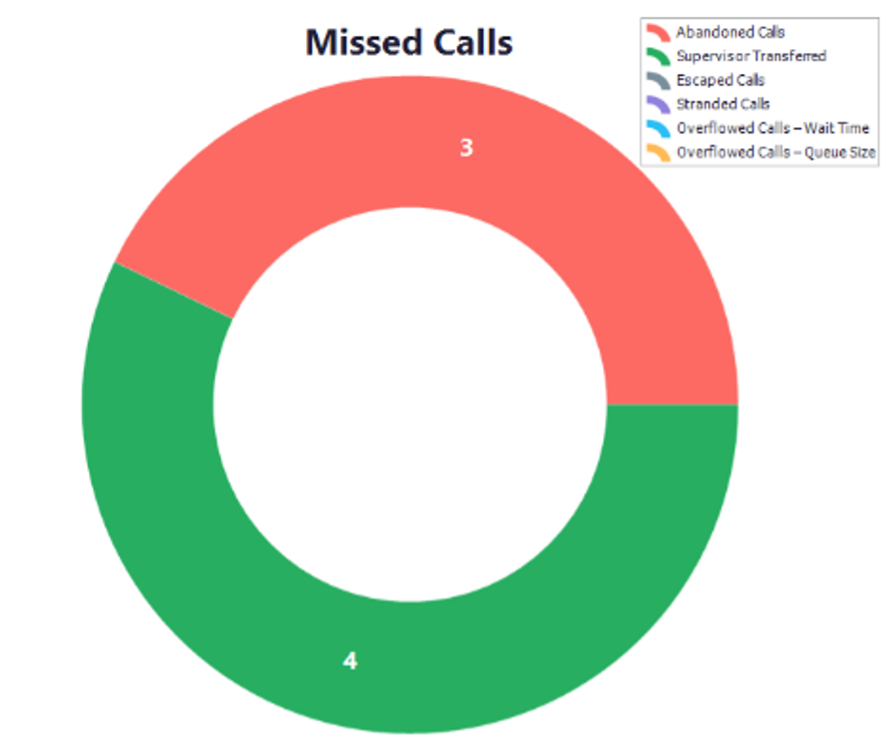
Monitor important statistics over a period of time by using bar and line charts. Or get a break down of a statistic by configuring a pie chart.
Please note: that thresholds cannot be configured for chart components.
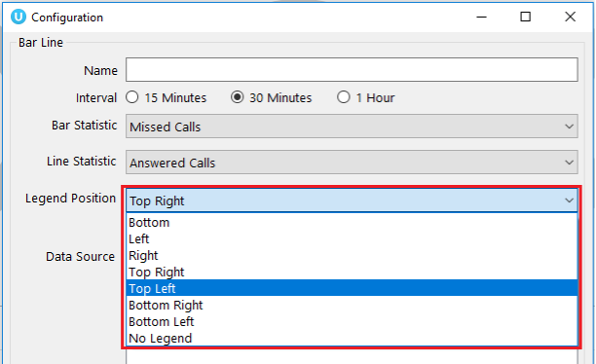
The user can change where the legend sits for the chart by right clicking on the element, selecting configure and then selecting from the drop-down menu, as shown below.
Selecting from the layout pre-sets
Unity Dashboard provides a list of pre-set layouts featuring different components that can then be configured and edited according to user preference. Select your desired layout from the drop-down list at the top and then give the template a name.
Data Source
Before configuring the statistics, you need to select the default data source at the top of the template, as shown below.
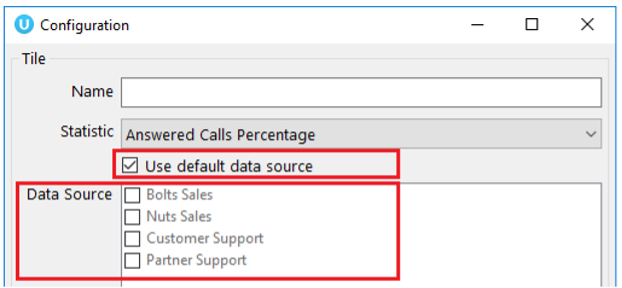
The default data source will be applied to all statistics by default, however this can be overridden when configuring the statistics by selecting from the list of data sources.
To select specific data sources untick the “use default data source” box and then select from the options.
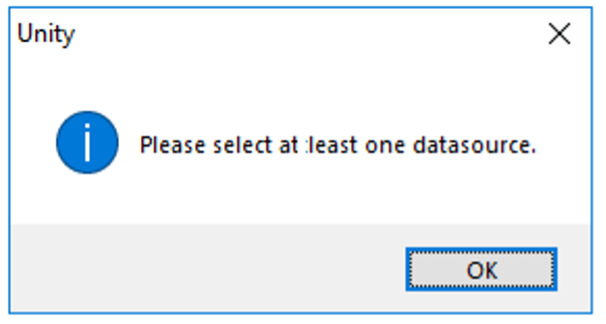
You need to configure the default data source in the template before selecting it in a statistic configuration otherwise you will see an alert, as shown below.
Adding graphical elements
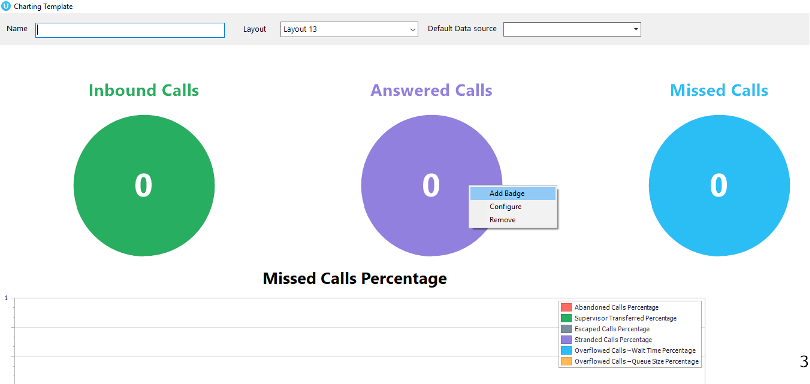
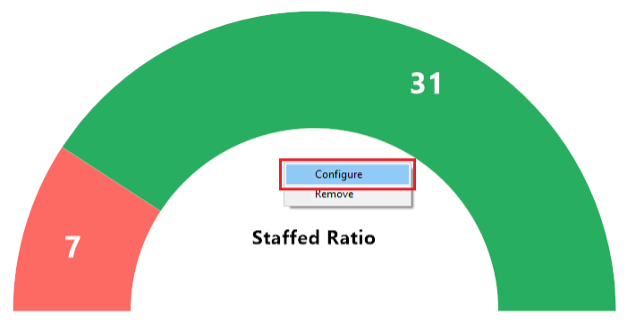
Users can easily add and remove elements from the pre-set layouts by right clicking on an element and selecting the desired option, as shown below.
Some stipulations apply, for example, you can only have up to 10 badges in one row and you cannot add another bar chart if there isn’t room.
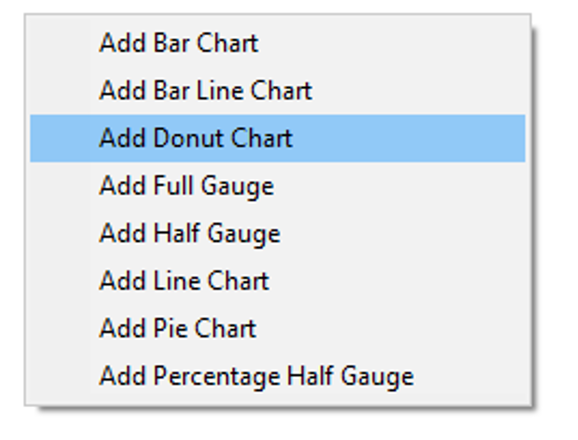
Users can also conveniently change the graphical elements by removing the elements in that section and then right clicking in the space and selecting from the list, as shown below.
Only elements available in that space will be available to choose from, for example, you cannot add a pie chart to a single top row.
Configuring the statistics
All pre-set layouts are completely configurable. Users can easily change the statistic being monitored from the pre-set ones, however some statistics are only available for certain graphical elements e.g. Staff Ratio cannot be set for a bar chart.
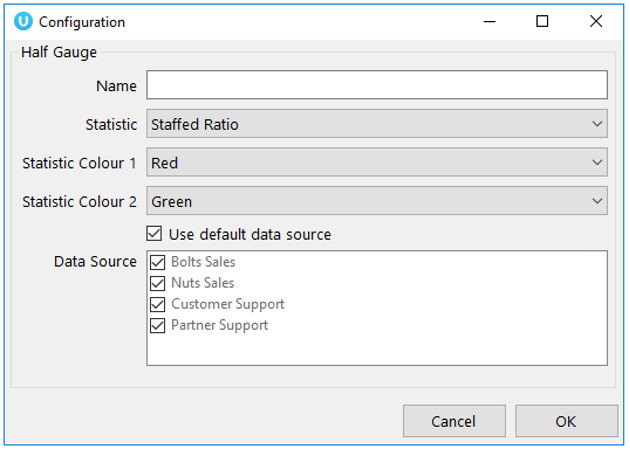
To change the statistic simply right click on the element and select configure.
Only the statistics available for that graphical element will be available from the drop-down menu. If certain statistics aren’t present then they are not available for that particular graphical element.
Unity Dashboard allows users to change the name of the statistic by using the Name section above the statistic. If this is left blank then the default statistic name will be used.
Thresholds
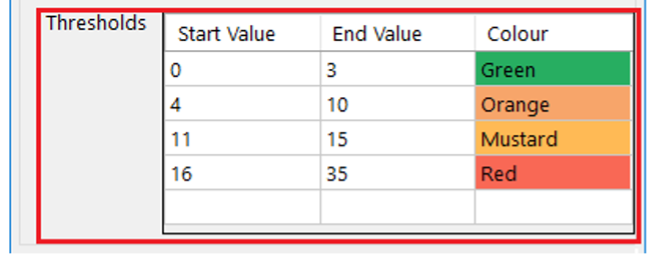
Color thresholds can be set for all graphical components with an additional icon threshold availale for tiles. There are two types of values that are entertained, one is non negative integers and the other one is time span. The validation for these values are done accordingly.
You cannot enter negative values for thresholds. If you enter a negative value for a threshold, then a validation message will popup telling you to enter a valid data.
If you try to enter a value which falls within an already set threshold then the user will be alerted with a message, as shown below. For example, if the first row’s start value is 0 and end value is 10, the user is not allowed to enter 8 as the next row’s start value.
The user is not allowed to provide an end value that is lesser than the start value. In this case the below shown message will be popped up. The end value should always be greater than the start value and vice versa.
If the selected item displays time duration then the value being entered should be in time span format (HH:MM:SS). For example Average call duration, Totall call duration, Average wait time etc.
Otherwise the below validation message will display.
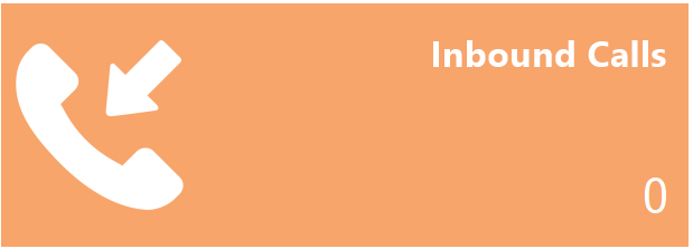
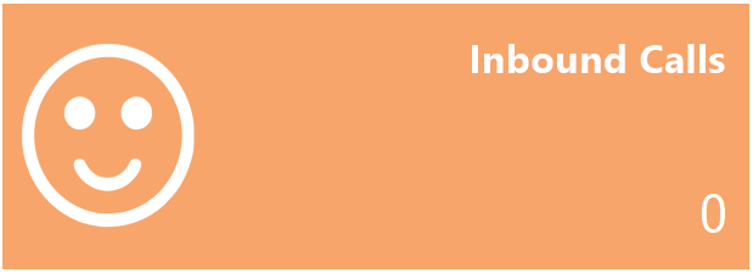
The Icon threshold is only available for statistics presented on a tile. If an icon threshold has been set then it will override the default icon, as shown below.
Default icon:
Threshold icon:
Users have the provision to delete a row in the thresholds by right clicking the desired row and clicking “Delete Row”, as shown below.
The Start value, End value, and Color should be provided otherwise the user won’t be able to save the display template; the user will be alerted with a message, as shown below.
Creating Views
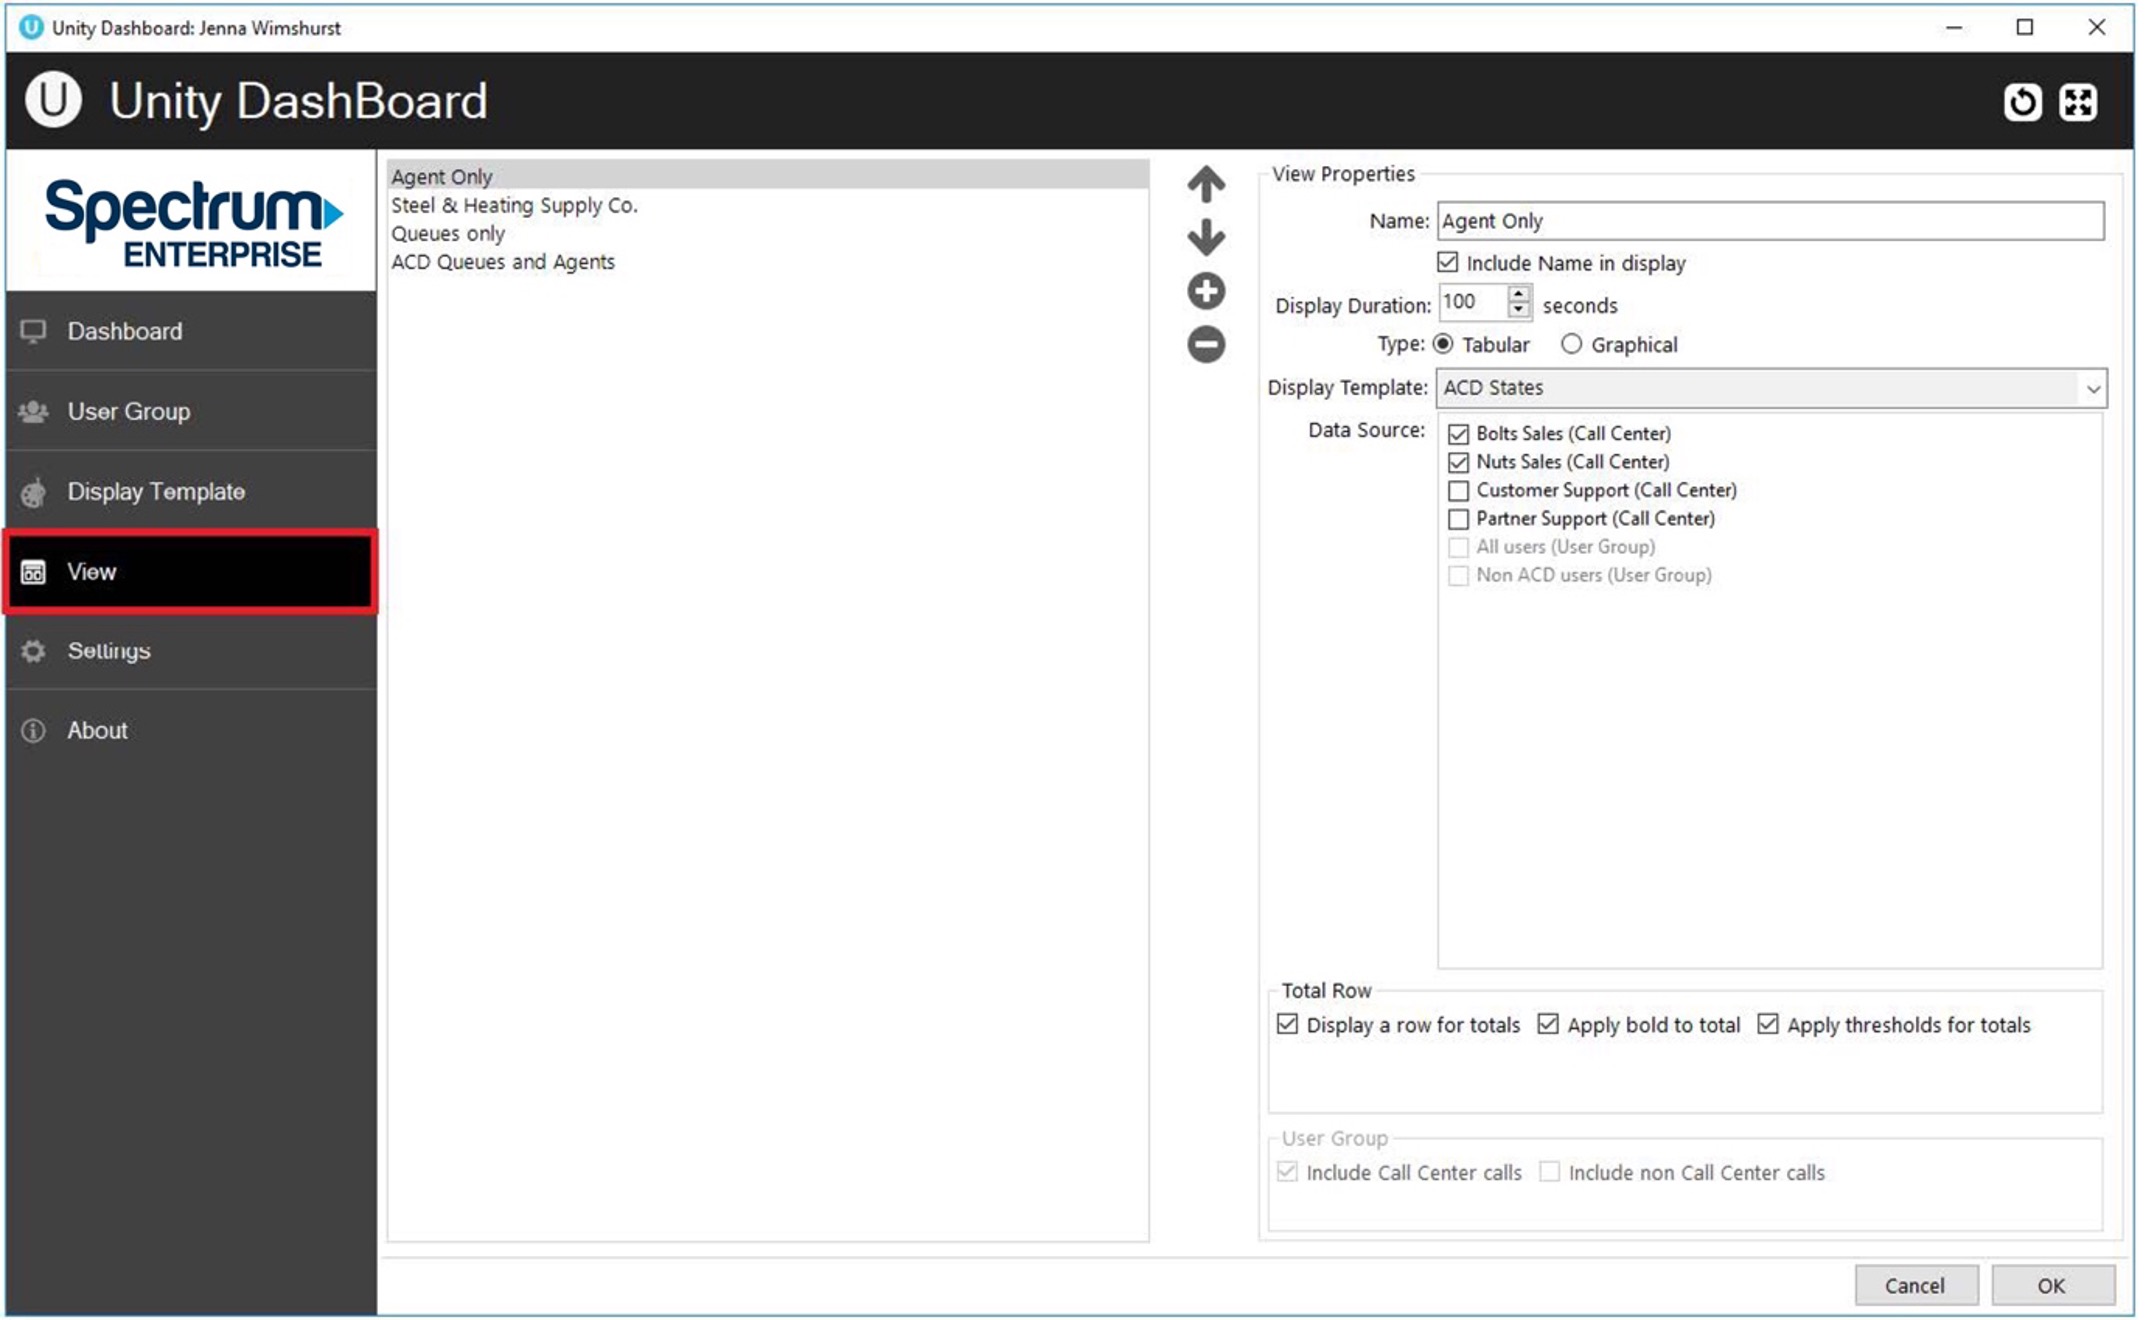
A view is the link between the Call Center or User Group (the data) and the statistics configured in the Display Template (the presentation). It tells the Dashboard which information to display and for how long. Click the View button to create new views or edit existing ones.
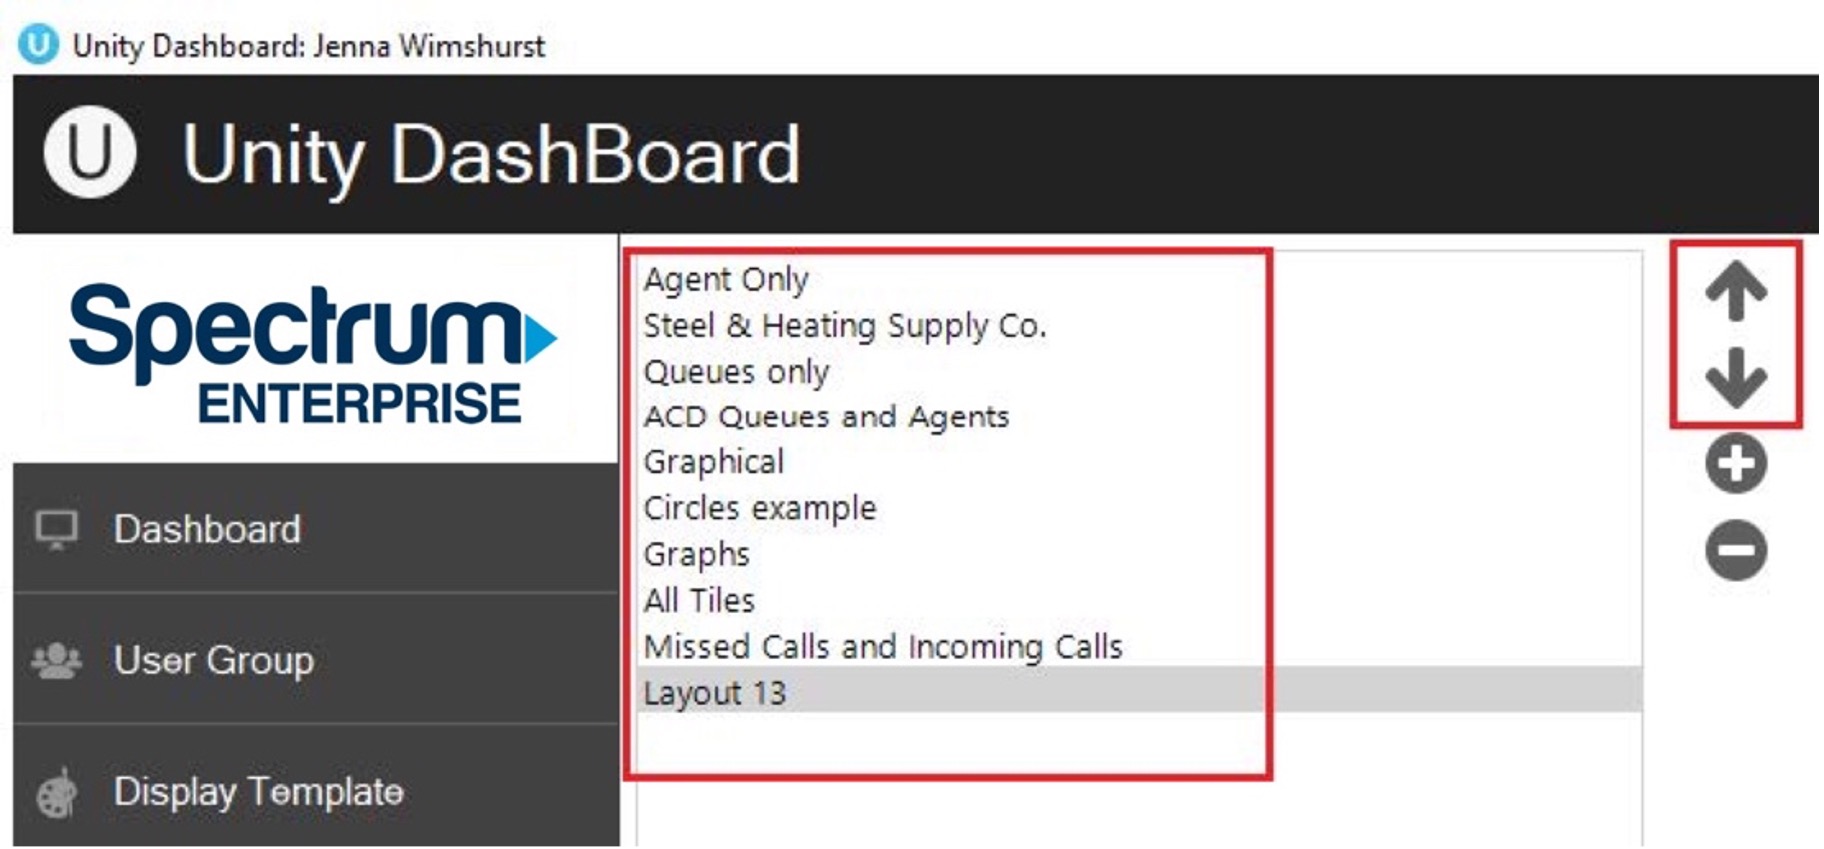
All configured views will be displayed on the left and the corresponding details of selected views will be displayed on the right as shown above. The user can Add, Edit, Re-order and Delete views using the buttons.
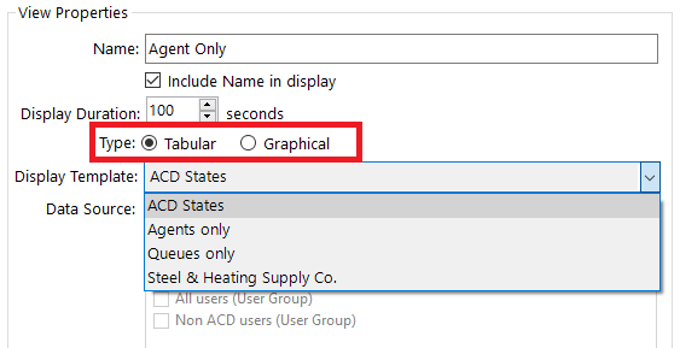
By default, the tabular view type is selected providing all tabular templates created in the drop-down list. To select a graphical template simply select “Graphical” and choose from the graphical templates presented in the drop-down list.
Configure the duration that the view will display for before moving onto the new view and select from the data sources if using a tabular template.
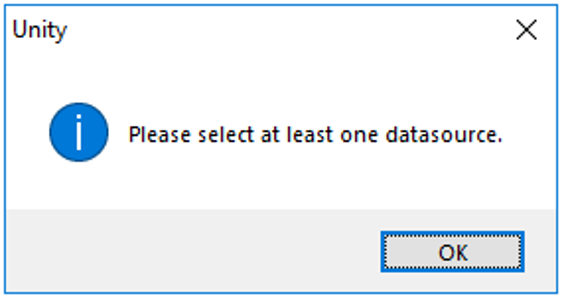
Unity will not allow you to proceed if you have chosen a tabular display template without selecting any data source.
Note: If the View Panel shows the User Groups to be greyed out when using Dashboard to display non-ACD statistics, this means that an ACD statistic has been selected in the Display Template and must be removed. ACD statistics cannot be applied to non-ACD User Groups.
Please note: If you select ACD only statistics (statistics that only apply to ACD Agents) in the display template then you will not be able to select a User Group from the data source when configuring the View.
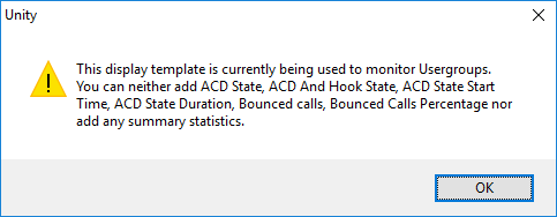
If you decide to change a display template by adding ACD only statistics after you’ve assigned it to a View that has a User Group ticked then the following alert will appear.
The Dashboard will not show any ACD only statistics in a View that has a User Group ticked. In order to do this you will need to create another View without a User Group in it.
All Views created will be listed with the option to re-order them by using the arrows.
Dashboard
The Dashboard displays the real-time updates, based on the data-set(s) and display template configured as part of the view. The list of views present is set to auto rotate, each view will be displayed according to the display duration set in the view. To skip to another view quickly, right click in the Dashboard and select the desired view.
Users can also select another view from the list of views displayed in the context menu.
Call Centers only
This view shows summary statistics for the selected Call Centers only, as shown below.
Agents only
The below view shows the user statistics for selected user groups. This view will only be displayed if the display template of the selected view does not contain any call center statistics.
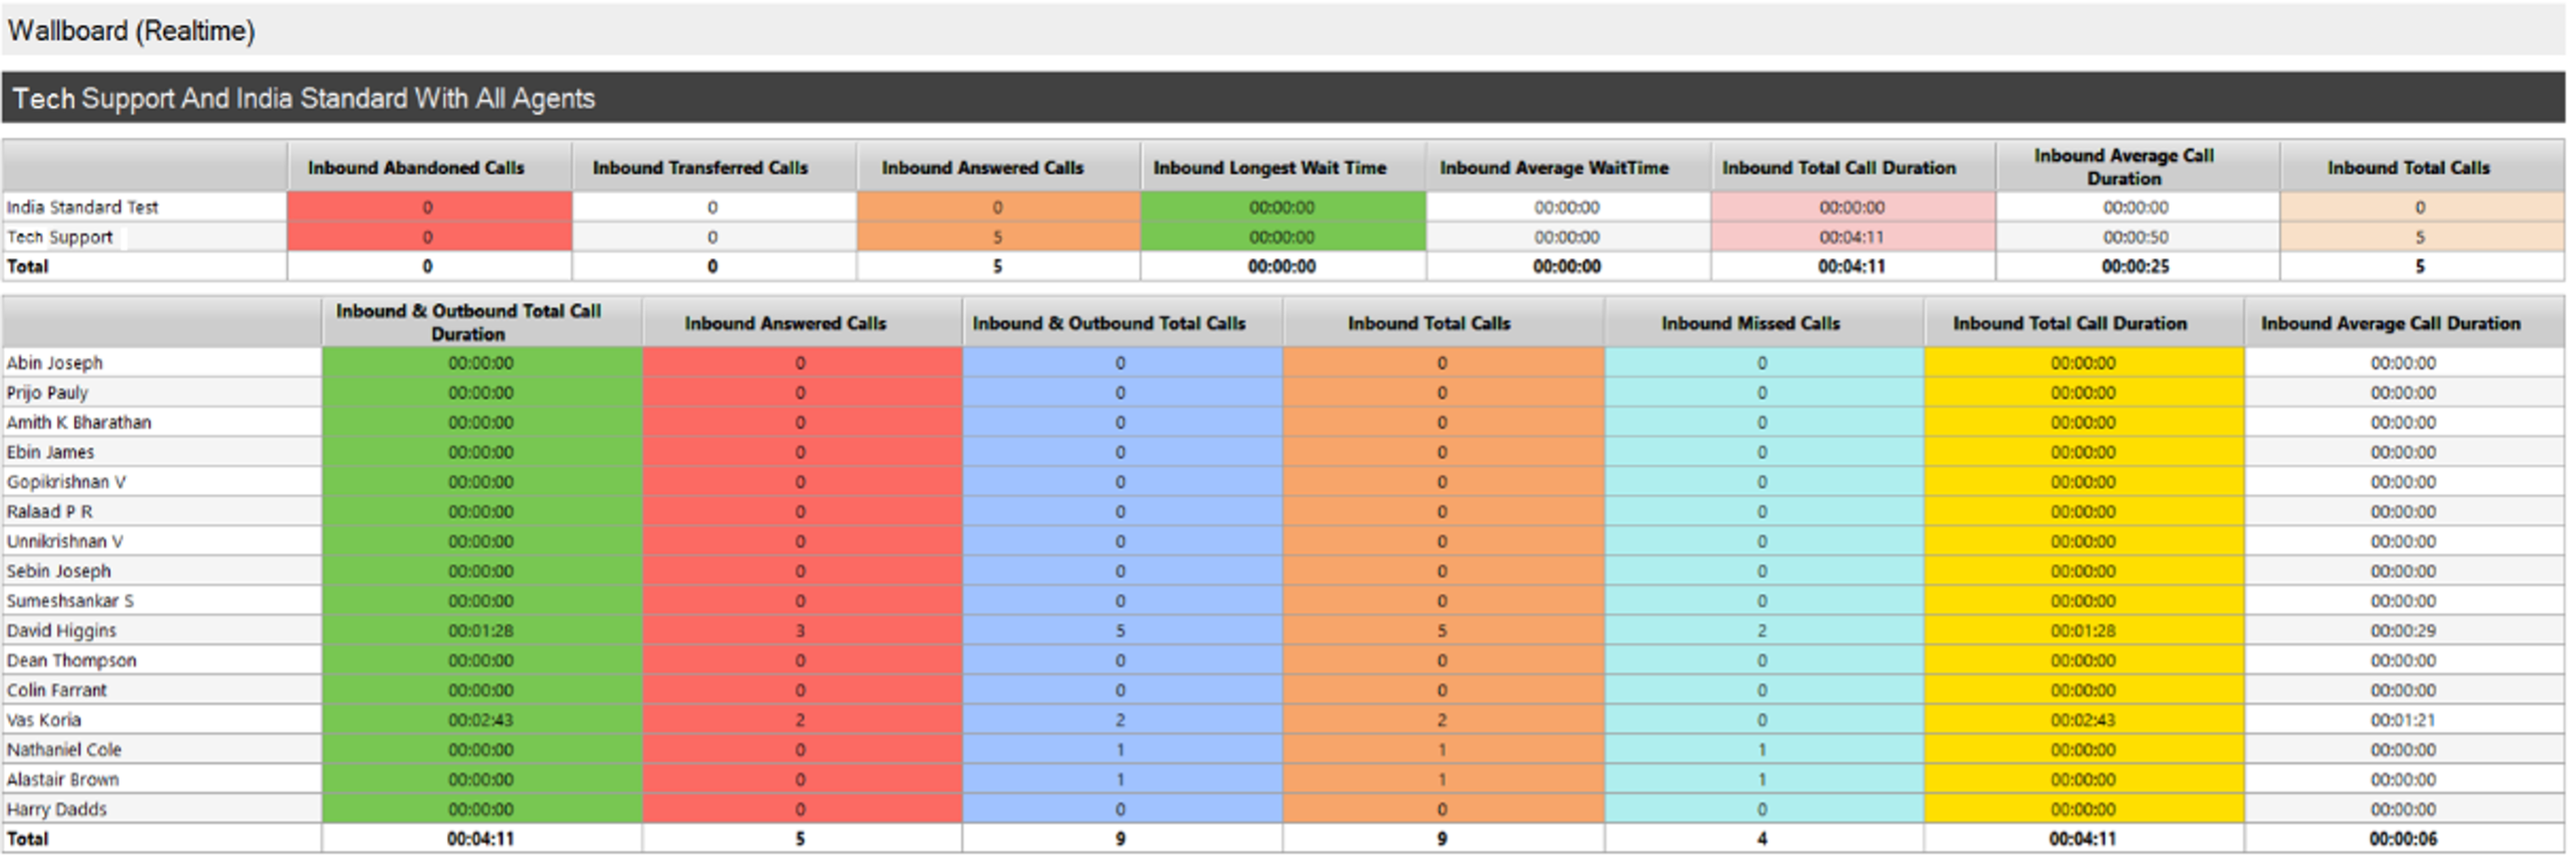
Call Center & Agents
The below view displays the detailed information of Call Centers and user groups/agents.
How to Retrieve Logs
From running application
Start ‘Unity Dashboard application. Tap on the about button.
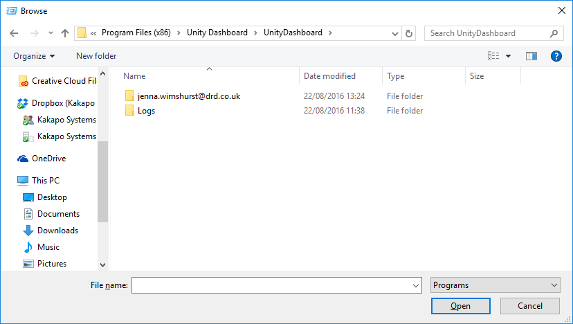
From the ‘About’ page, left click on the folder path to show the working folder contents in file explorer. You may also navigate to the working folder. You can find the “logs” folder inside the “Unity Dashboard” folder as shown below.
If the user is unable to start the Unity application itself, the user can still retrieve the logs as follows:
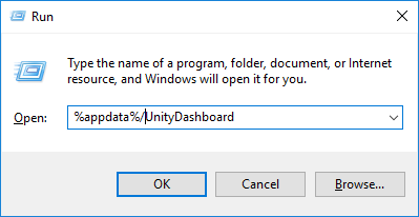
Press the Windows key then ‘R’, enter “%appdata%/UnityDashboard” and click ok.
You can find the “logs” folder inside the “Unity Dashboard” folder.
Troubleshooting
- When there is an internet connectivity loss, Unity Dashboard clears the statistics listed below:
- Longest Wait Time
- Staffed Ratio
- Hook State
- Hook State Duration
- ACD And Hook State (only Hook State)
- If you select ACD only statistics (statistics that only apply to ACD Agents) in the display template then you will not be able to select a User Group from the data source when configuring the View.
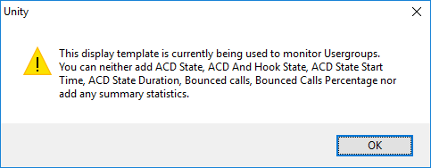
- If you decide to change a display template by adding ACD only statistics after you’ve assigned it to a View that has a User Group ticked then the following alert will appear.
- The Dashboard will not show any ACD only statistics in a View that has a User Group ticked. In order to do this you will need to create another View without a User Group in it.


 Print and share