Unity Dashboard Tabular & Graphical Quick Start Guide
Table of contents
Login to Unity Dashboard
To monitor Call Center statistics, the user who logs into Unity Dashboard should be a supervisor in the Call Centers that they wish to monitor. The address of BroadSoft CTI server and OCI-P server is also required.
User Groups
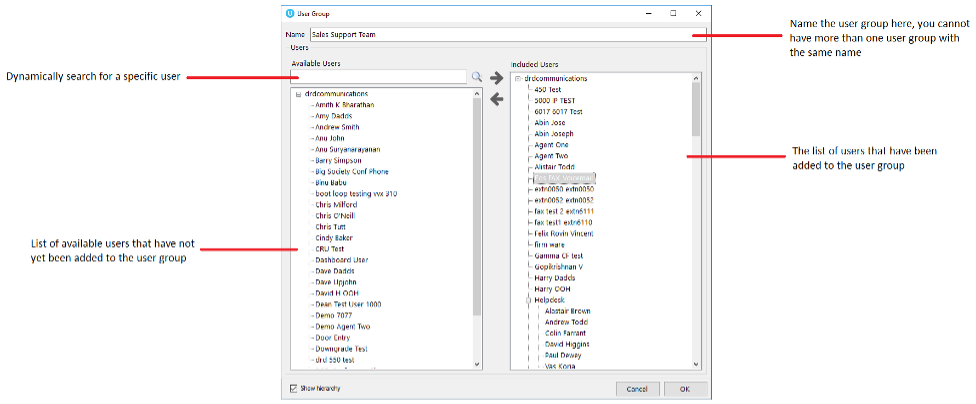
If you want to monitor users as well as agents, then you need to create a user group. A User Group represents a logical grouping of users outside of a Call Center. This grouping is internal to Unity Dashboard, it is not stored or used elsewhere in BroadSoft.
Display Templates
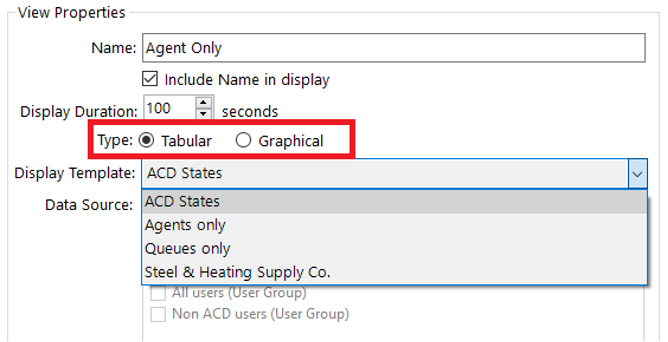
The display template section allows you to create and configure both tabular and graphical templates that define grouping of statistics.
You have the provision to add, edit and delete display templates using the buttons to the right of the box, you can also edit a display template by double clicking the display template.
Tabular templates
Dashboard’s tabular templates show the information in a table/grid layout with headers, rows and columns which can be presented for both call center queues and individual agents.
Add/Edit Display Template
You can add a new tabular Display Template and change any existing tabular Display Templates by using the left-hand column.
Click on the add icon to the right to create a new tabular template.
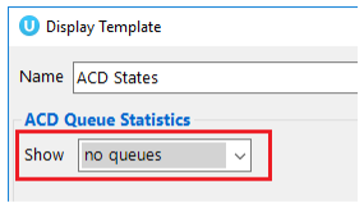
The Display Template is divided into ACD Queue Statistics at the top and Agent/User Statistics below. These are mix and match, to make a Display Template with only Queue statistics select “no agents” in the Agent/User Statistics drop list.
Selecting Statistics
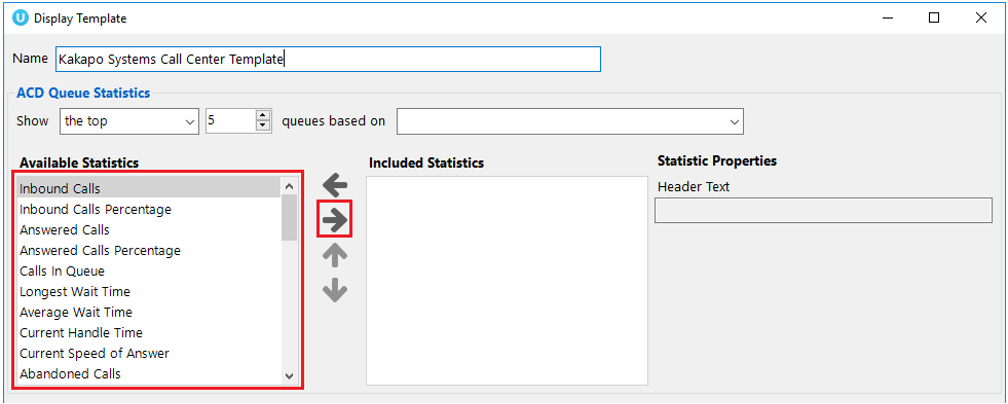
To add data to the included column, you can either double click on the statistic in the available column or select the statistic and then click on the right arrow.
Configuring Thresholds
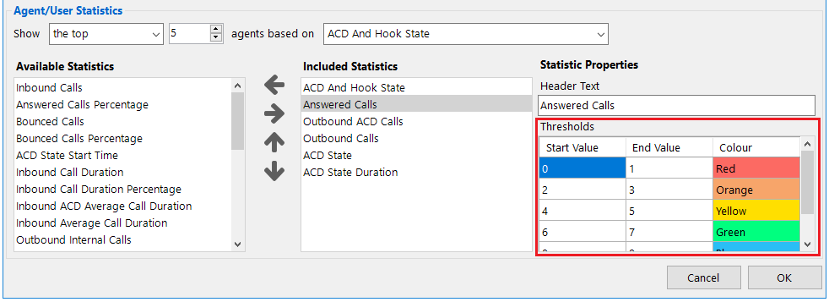
Threshold values can be set for each item in the included column list:
Graphical templates
Dashboard’s graphical templates show the information in a variety of graphical elements including charts, tiles, badges and half and full gauges.
Add/Edit Display Template
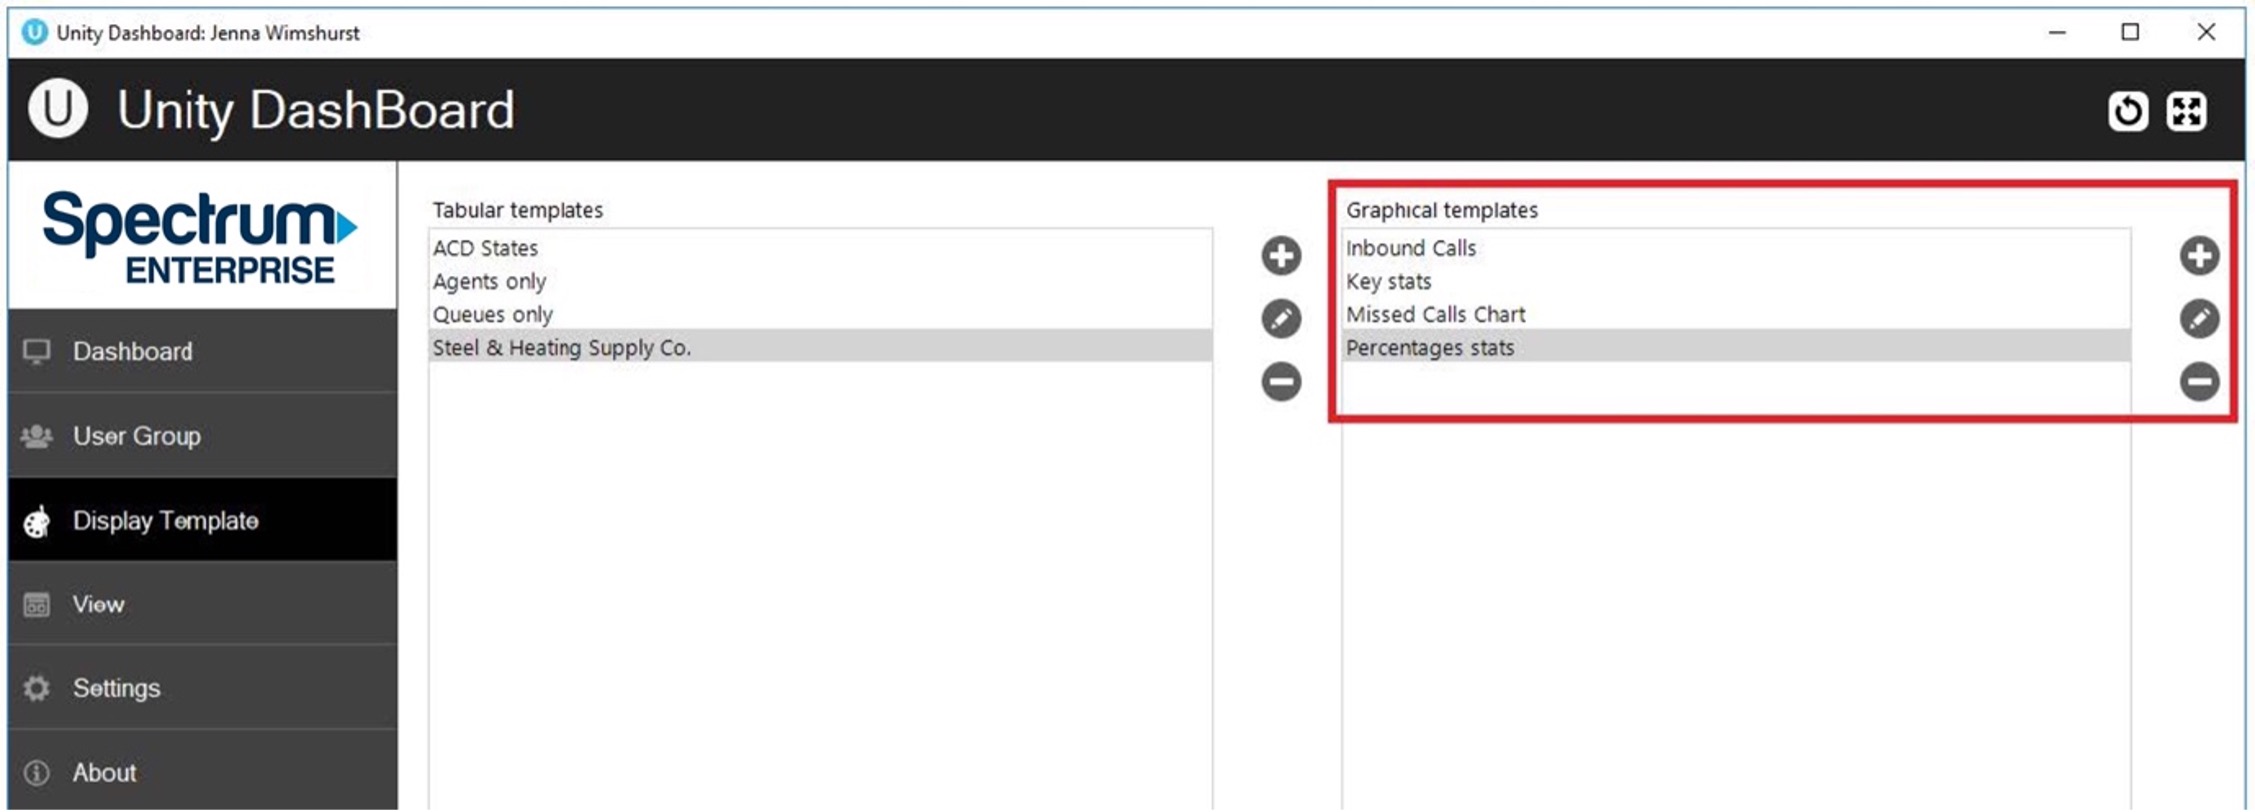
To add or edit a graphical display template go to Display Templates on the left-hand menu. The two types of templates, tabular and graphical are presented next to each other.
To add a new graphical template, click the plus icon on the far right or to edit an existing template double click the template, or select it and click the pen icon.
Selecting from the layout pre-sets
Unity Dashboard provides a list of pre-set layouts featuring different components that can then be configured and edited according to user preference. Select your desired layout from the drop-down list at the top and then give the template a name.
Data source
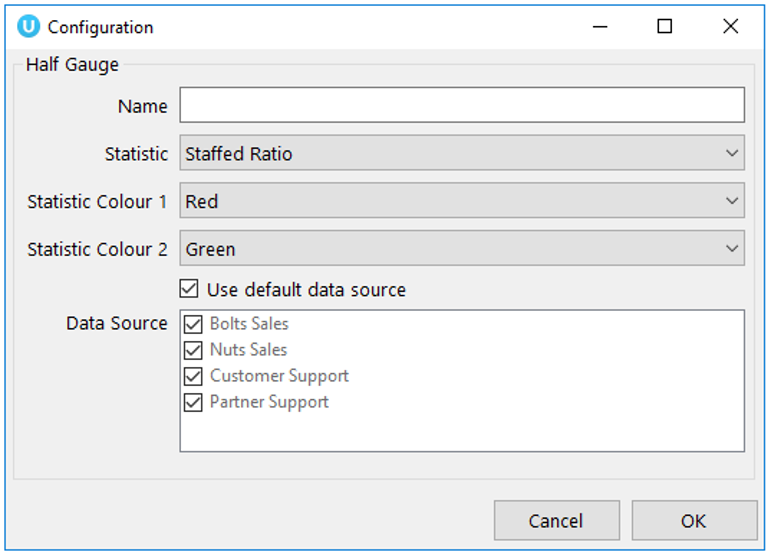
Before configuring the statistics, you need to select the default data source at the top of the template, as shown below.
The default data source will be applied to all statistics by default, however this can be overridden when configuring the statistics by selecting from the list of data sources.
Configuring the statistics
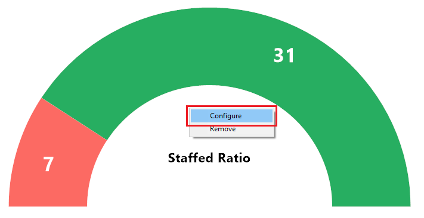
To change the statistic simply right click on the element and select configure.
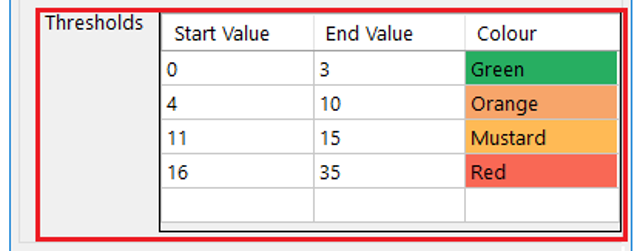
Thresholds
Color thresholds can be set for all graphical components with an additional icon threshold availale for tiles:
Creating News
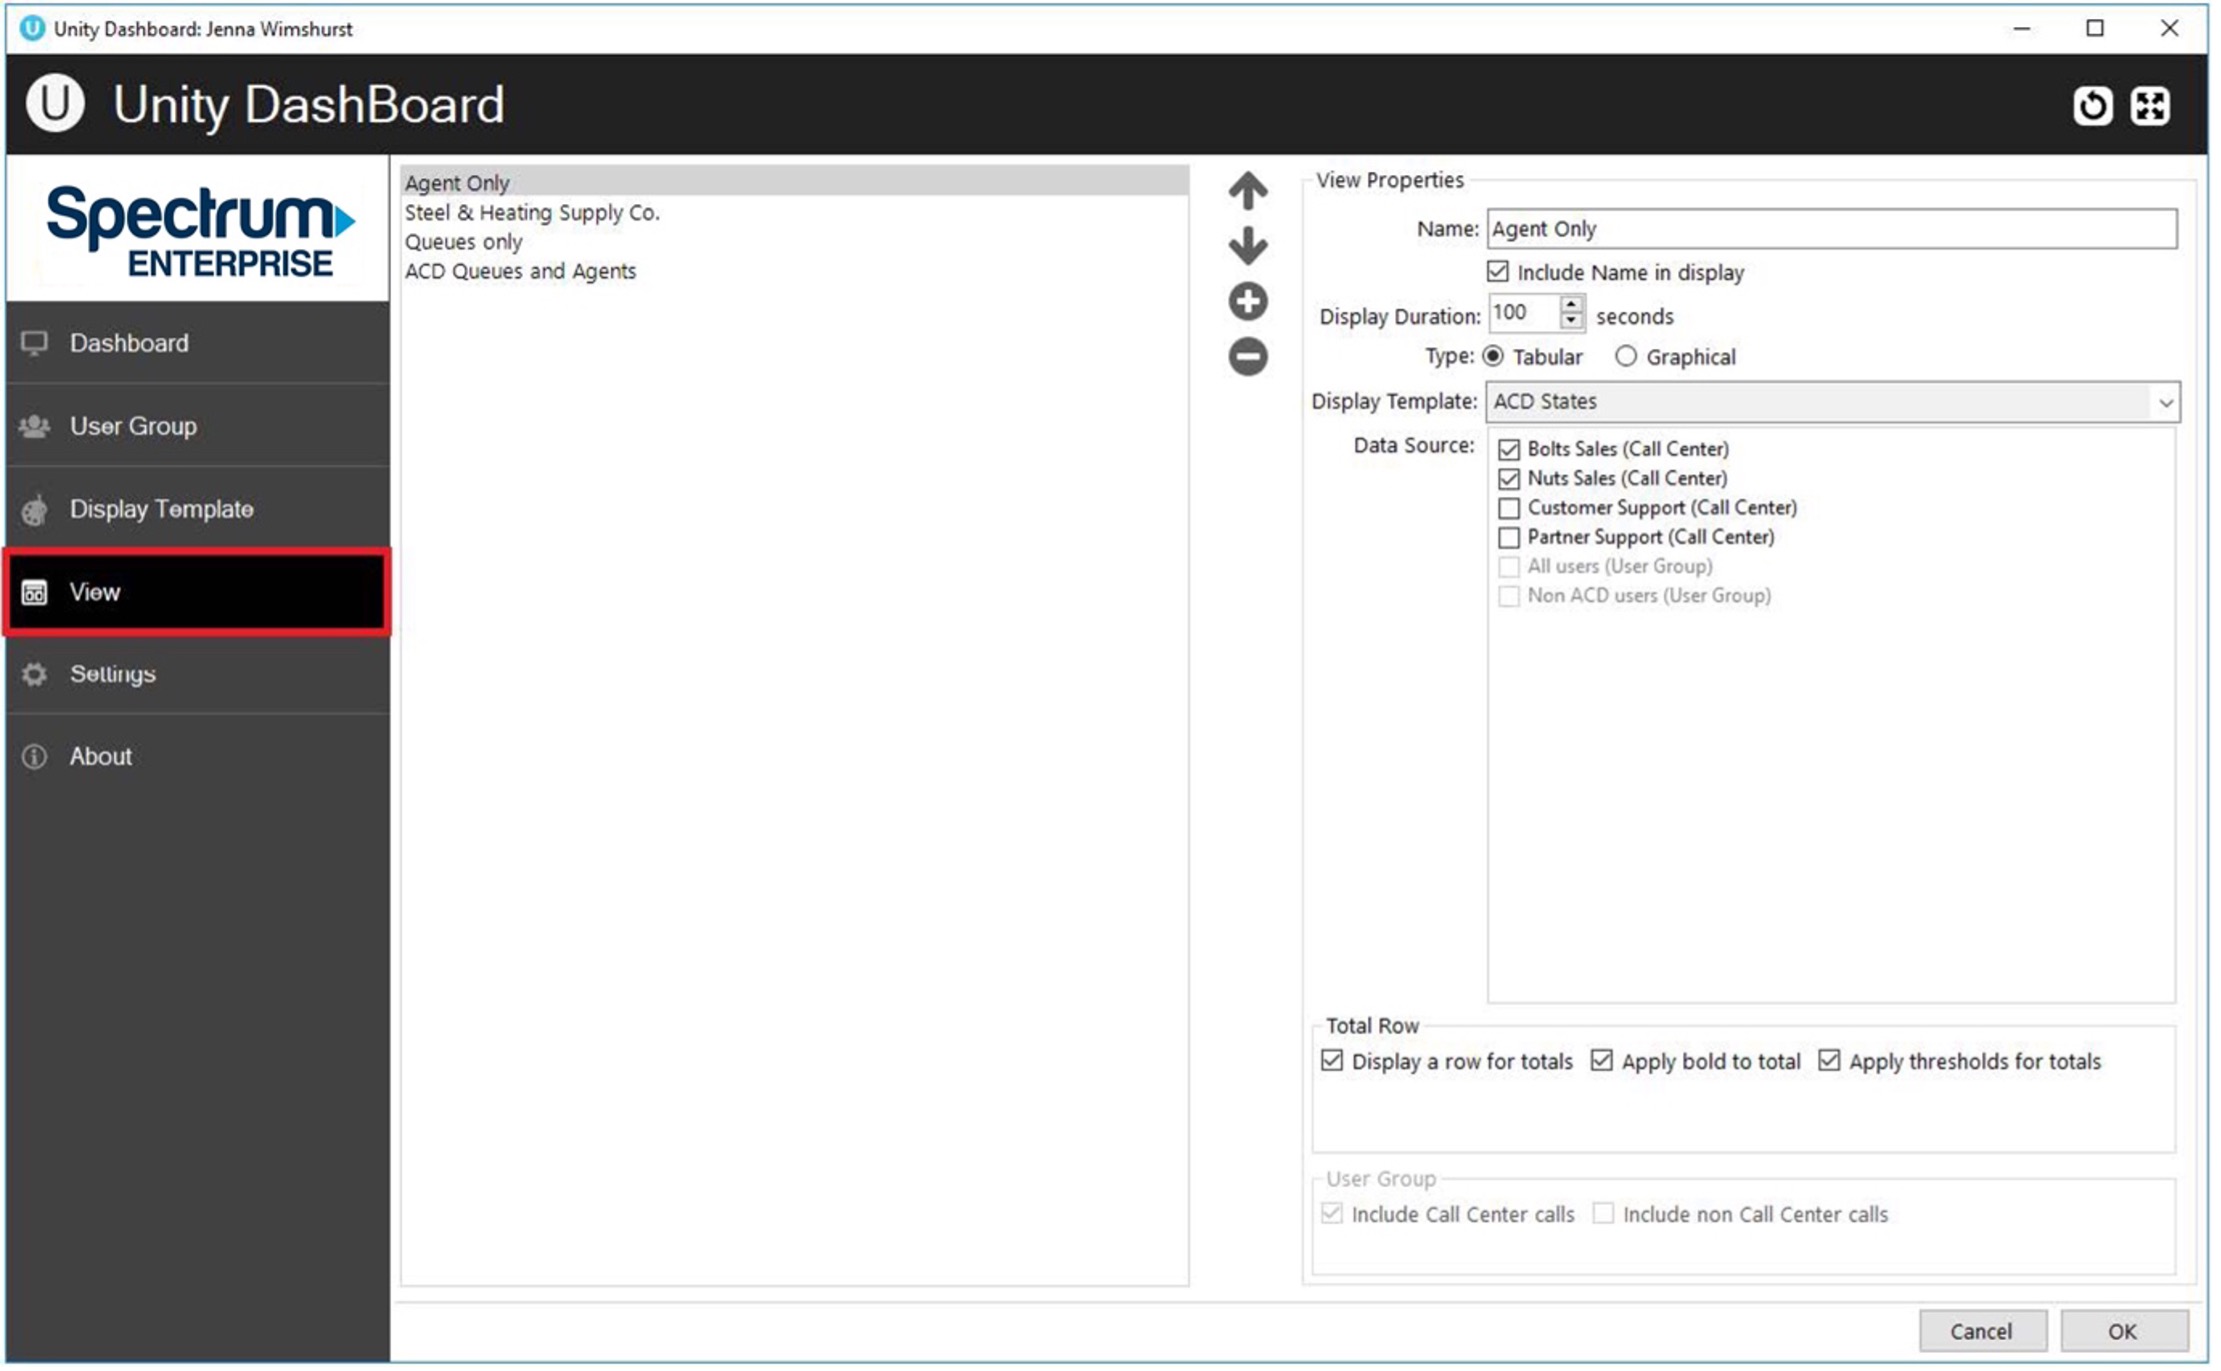
A view is the link between the Call Center or User Group (the data) and the statistics configured in the Display Template (the presentation). It tells the Dashboard which information to display and for how long. Click the View button to create new views or edit existing ones.
All configured views will be displayed on the left, you can Add, Edit, Re-order and Delete views using the buttons. Configure the duration that the view will display for before selecting the desired settings.
Dashboard
Once you have configured the templates and views Dashboard is ready to go, simply click on “Dashboard” on the left-hand side and the list of views present will auto rotate, each view will be displayed according to the display duration set in the view. To skip to another view quickly, right click in the Dashboard and select the desired view.


 Print and share